Figures & data
Figure 1 Chemical structures, names, and codes for polyelectrolytes.
Abbreviation: MW, molecular weight.
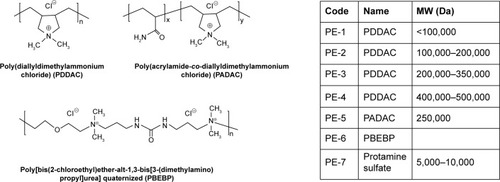
Figure 2 Viability of C2C12E50 cells after treatment with PEs at three doses (4, 10, 20 µg/mL from left to right for each polymer; PEI 25,000 was used as the comparison) determined by MTS assay. The cells were seeded in 96-well plates at an initial density of 1×10⁴ cells/well in 0.2 mL of growth medium. The results are presented as the mean ± standard deviation (n=3, Student’s t-test, *P≤0.05 compared with untreated cells).
Abbreviations: PEs, polyelectrolytes; PEI, polyethylenimine; MTS, [3-(4,5-dimethylthiazol-2-yl)-5-(3-carboxymethoxyphenyl)-2-(4-sulfophenyl)-2H-tetrazolium].
![Figure 2 Viability of C2C12E50 cells after treatment with PEs at three doses (4, 10, 20 µg/mL from left to right for each polymer; PEI 25,000 was used as the comparison) determined by MTS assay. The cells were seeded in 96-well plates at an initial density of 1×10⁴ cells/well in 0.2 mL of growth medium. The results are presented as the mean ± standard deviation (n=3, Student’s t-test, *P≤0.05 compared with untreated cells).Abbreviations: PEs, polyelectrolytes; PEI, polyethylenimine; MTS, [3-(4,5-dimethylthiazol-2-yl)-5-(3-carboxymethoxyphenyl)-2-(4-sulfophenyl)-2H-tetrazolium].](/cms/asset/14ba4350-81de-4bad-9df2-c130db11b452/dijn_a_89910_f0002_c.jpg)
Figure 3 Delivery efficiency and toxicity of PMOE50/PE complexes in a C2C12E50 cell line determined by fluorescence microscopy and fluorescence-activated cell sorting analysis.
Notes: (A) Representative fluorescence images of PMO-induced exon-skipping in the C2C12E50 cell line. The images were taken 48 hours after treatment. Original magnification, 100×. (B) Transfection efficiency of PMO formulated with PEs (one-way analysis of variance test, #P≤0.05 indicates a significant difference between PE groups; Student’s t-test, *P≤0.05 compared with PMO only). (C) Cell viability (one-way analysis of variance test, P=0.585, no significant difference between PE groups was found; Student’s t-test, *P≤0.05 compared with untreated cells). In this test, 5 µg of PMOE50 were formulated with PEs (1, 2, 5 µg), and PEI 25,000 (2 µg), and Endoporter (5 µg) was formulated as the control in 0.5 mL of 10% fetal bovine serum-Dulbecco’s Modified Eagle’s Medium, respectively. The results are presented as the mean ± standard deviation, in triplicate.
Abbreviations: PEs, polyelectrolytes; PEI, polyethylenimine; PMO, phosphorodiamidate morpholino oligomer.
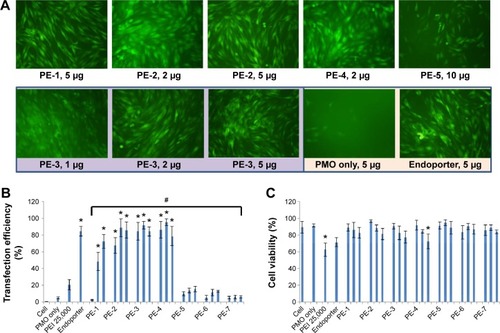
Figure 4 Flow cytometry diagram. The upper panel shows the flow cytometry dot plots (FSC-SSC) and the lower panel shows the histograms (FL).
Abbreviations: PE, polyelectrolyte; PEI, polyethylenimine; PMO, phosphorodiamidate morpholino oligomer; FSC, forward scatter; SSC, side scatter; FL, flourescence.
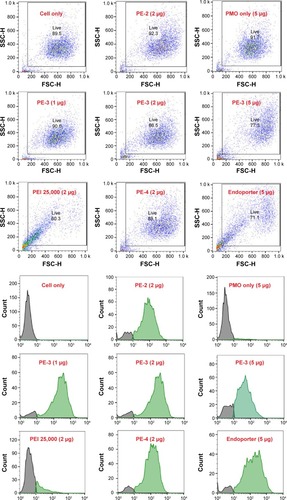
Figure 5 Green fluorescent protein expression induced by PMOE23 (5 µg) formulated with PEs in C2C12E23 cells (PE or Endoporter 5 µg and PMOE23 5 µg in 0.5 mL of 10% fetal bovine serum-Dulbecco’s Modified Eagle’s Medium after 48 hours treatment). Upper panel shows fluorescence detection of green fluorescent protein expression, original magnification, 100×; Lower panel shows reverse transcription-polymerase chain reaction of exon 23 skipping.
Abbreviations: PE, polyelectrolyte; PMO, phosphorodiamidate morpholino oligomer.
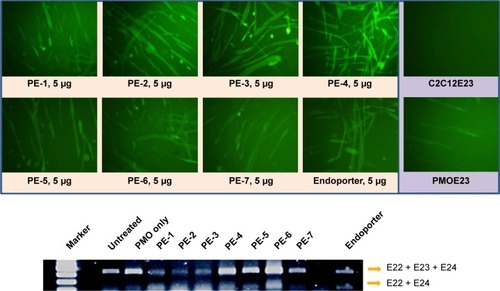
Figure 6 Confocal microscopic images of C2C12 cells treated with FITC-PMO (2 µg) without and with PE-4 (5 µg). Nuclear staining with Hoechst 33258. The images were obtained under a magnification of 63×. Labeled PMO can be observed at lower levels throughout the treated cells; however, with the addition of PE-4, greater levels of labeled PMO can be observed with greater concentrations in the perinuclear space.
Abbreviations: PE, polyelectrolyte; FITC, fluorescein isothiocyanate; PMO, phosphorodiamidate morpholino oligomer.
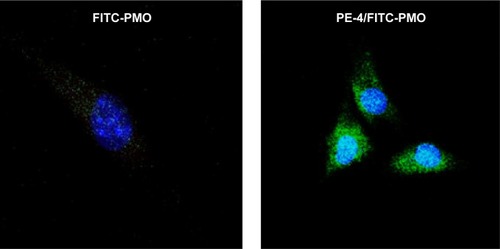
Figure 7 Negatively stained transmission electron micrographs of PE (5 µg) with and without PMO (5 µg) complexes and PMO only (scale bar, 100 nm).
Abbreviations: PE, polyelectrolyte; PMO, phosphorodiamidate morpholino oligomer.
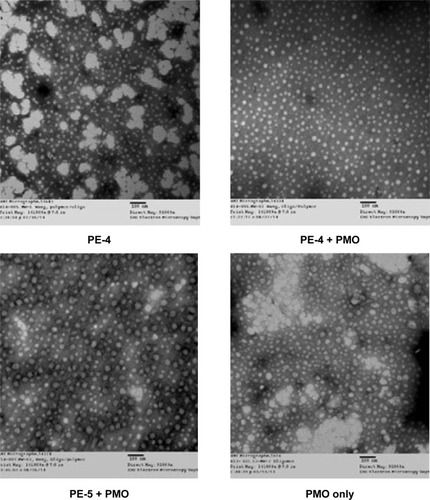
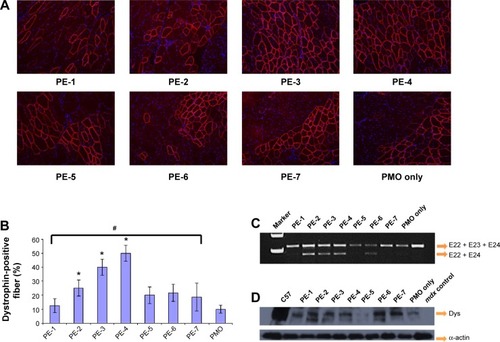
Figure 8 Restoration of dystrophin in tibialis anterior muscles of mdx mice (aged 4–5 weeks) 2 weeks after intramuscular injection.
Notes: (A) Dystrophin was detected by immunohistochemistry with rabbit polyclonal antibody P7 against dystrophin. Blue nuclear staining with 4,6-diamidino-2-phenylindole. Muscles treated with PMOE23 (2 µg) only was used as controls. All other samples were from muscles treated with 2 µg polymer and 2 µg PMOE23 in 40 µL saline. Original magnification, 100×. (B) The percentage of dystrophin-positive fibers in muscles treated with 2 µg PMOE23 with and without polymers (2 µg). The maximum numbers of dystrophin-positive fibers were counted in a single cross-section (n=5, one-way analysis of variance test, #P≤0.05, there were significant difference between PE groups; Student’s t-test, *P≤0.05 compared with 2 µg PMO). (C) Detection of exon 23 skipping by reverse transcription-polymerase chain reaction. Total RNA of 100 ng from each sample was used for amplification of dystrophin mRNA from exon 20 to exon 26. The upper bands (indicated by E22 + E23 + E24) correspond to the normal mRNA, and the lower bands (indicated by E22 + E24) correspond to the mRNA with exon E23 skipped. (D) Western blots demonstrate the expression of dystrophin protein. Dystrophin detected with monoclonal antibody Dys 1. A loading control (α-actin) was used.
Abbreviations: Dys, dystrophin; PE, polyelectrolyte; PMO, phosphorodiamidate morpholino oligomer.