Figures & data
Table 1 Particle size and zeta potential of N-Ac-l-Leu-PEI/Dz nanocomplex
Figure 1 Gel retardation assay for the nanocomplexes of N-Ac-l-Leu-PEI with DNAzyme at different mass ratios.
Abbreviation: N-Ac-l-Leu-PEI, N-acetyl-l-leucine-polyethylenimine.
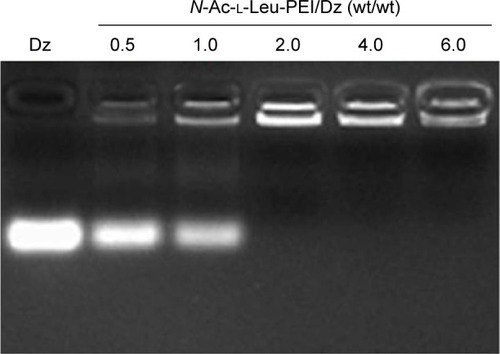
Figure 2 Flow cytometric analysis of the cellular uptake of N-Ac-l-Leu-PEI/Dz (A) and the quantitative measurement of mean fluorescence intensity (B).
Abbreviations: N-Ac-l-Leu-PEI, N-acetyl-l-leucine-polyethylenimine; FITC, fluorescein isothiocyanate; h, hour.
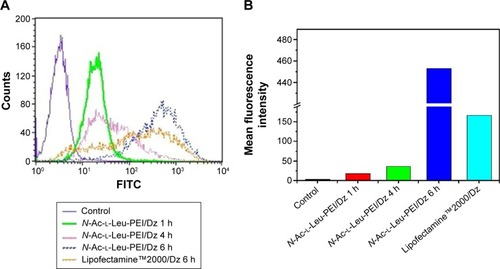
Figure 3 Effects of different inhibitors on the endocytosis of N-Ac-l-Leu-PEI/Dz using flow cytometric analysis (A) and the quantitative analysis of mean fluorescence intensity (B).
Abbreviations: N-Ac-l-Leu-PEI, N-acetyl-l-leucine-polyethylenimine; FITC, fluorescein isothiocyanate; h, hour.
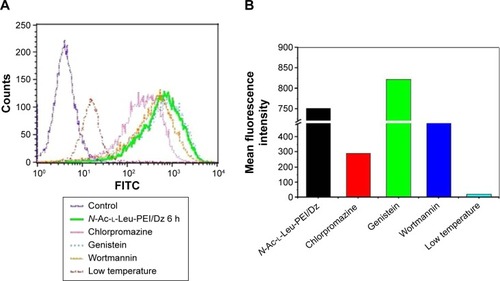
Figure 4 CLSM images of the intracellular distribution of N-Ac-l-Leu-PEI/Dz nanocomplex for 1 hour and 4 hours.
Notes: Blue, nuclei (DAPI); red, lysosome (Lyso-Tracker Red); green, DNAzyme (FITC-labeled). The boxed areas represent the enlarged cells to show the intracelluar distribution of nanocomplex.
Abbreviations: CLSM, confocal laser scanning microscopy; N-Ac-l-Leu-PEI, N-acetyl-l-leucine-polyethylenimine; h, hour; DAPI, 4,6-diamidino-2-phenylindole; FITC, fluorescein isothiocyanate.
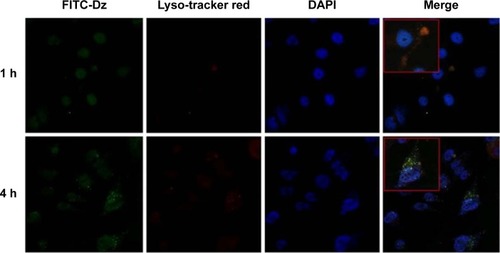
Figure 5 Cell viabilities of PC-3 cells treated with N-Ac-l-Leu-PEI/Dz nanocomplex (wt/wt, 6:1) with different amounts of DNAzyme for 24 hours (A) and 72 hours (B).
Notes: The data presented the difference between cell viabilities of the carriers and corresponding transfection nanocomplex. The data were expressed as mean value ± SD of three experiments, and significance was determined by a Student’s t-test (*P<0.05, compared with naked Dz group).
Abbreviations: N-Ac-l-Leu-PEI, N-acetyl-l-leucine-polyethylenimine; SD, standard deviation.
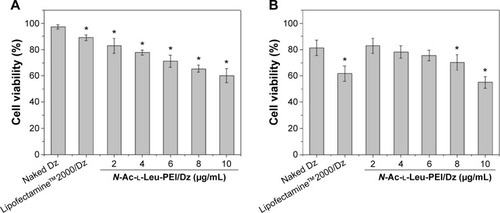
Figure 6 The inhibition of colony formation (A) and the absorbance at 578 nm of eluent (B) after DNAzyme transfection.
Notes: The data were expressed as mean value ± SD of three experiments, and significance was determined by a Student’s t-test (*P<0.05, compared with control).
Abbreviations: N-Ac-l-Leu-PEI, N-acetyl-l-leucine-polyethylenimine; SD, standard deviation.
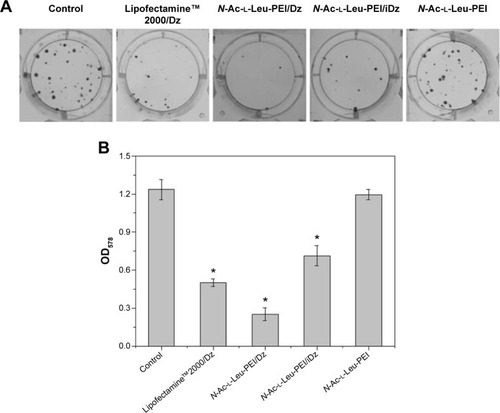
Figure 7 Western blotting (A) and quantitative analysis (B) for the expression level of aurora kinase A and MMP-9 after DNAzyme transfection.
Notes: 1: No treatment; 2: N-Ac-l-Leu-PEI/Dz; 3: Lipofectamine™2000/Dz; and 4: N-Ac-l-Leu-PEI/iDz.
Abbreviations: N-Ac-l-Leu-PEI, N-acetyl-l-leucine-polyethylenimine; iDz, inactive DNAzyme; MMP-9, matrix metalloproteinase-9.
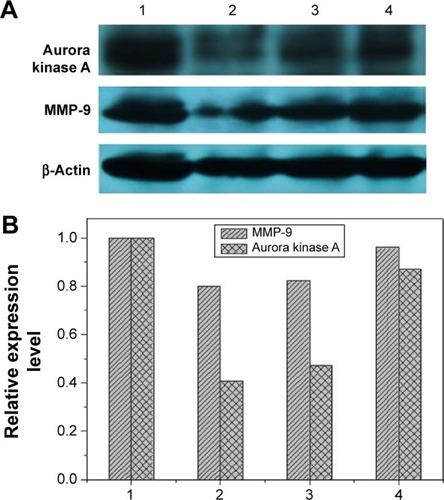
Figure 8 Induction of apoptosis in PC-3 cells treated with DNAzyme transfection determined by flow cytometry.
Notes: (A) No treatment; (B) treatment with N-Ac-l-Leu-PEI; (C) treatment with N-Ac-l-Leu-PEI/iDz; (D) treatment with Lipofectamine™2000/Dz; and (E) treatment with N-Ac-l-Leu-PEI/Dz.
Abbreviations: N-Ac-l-Leu-PEI, N-acetyl-l-leucine-polyethylenimine; iDz, inactive DNAzyme, PI, propidium iodide; FITC, fluorescein isothiocyanate.
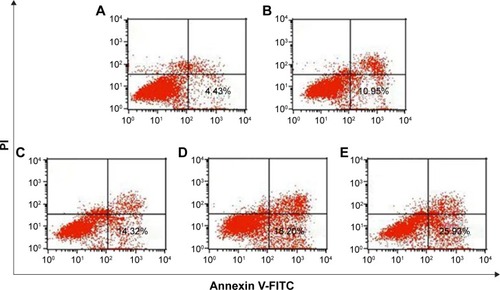
Figure 9 Induction of cell cycle arrest in PC-3 cells treated with DNAzyme transfection determined by flow cytometry.
Notes: (A) No treatment; (B) treatment with N-Ac-l-Leu-PEI for 24 hours; (C) treatment with N-Ac-l-Leu-PEI/iDz for 24 hours; (D) treatment with Lipofectamine™2000/Dz (6 μg DNAzyme) for 48 hours; (E–G) treatment with N-Ac-l-Leu-PEI/Dz for 24 hours with a DNAzyme amount of 2 μg, 4 μg, and 6 μg, respectively; and (H) treatment with N-Ac-l-Leu-PEI/Dz with a DNAzyme amount of 6 μg for 48 hours.
Abbreviations: N-Ac-l-Leu-PEI, N-acetyl-l-leucine-polyethylenimine; iDz, inactive DNAzyme.
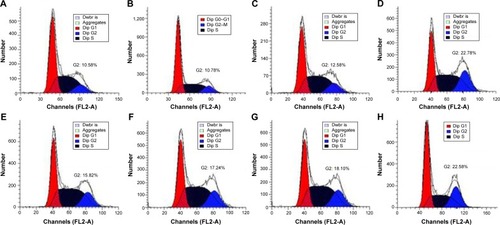
Figure 10 Wound healing assay (A) and quantitative wound size (B) after DNAzyme transfection.
Notes: 1: No treatment; 2: Lipofectamine™2000/Dz; 3: N-Ac-l-Leu-PEI/Dz; 4: N-Ac-l-Leu-PEI/iDz; and 5: N-Ac-l-Leu-PEI. The data were expressed as mean value ± SD of three experiments, and significance was determined by a Student’s t-test (*P<0.05, compared with control).
Abbreviations: N-Ac-l-Leu-PEI, N-acetyl-l-leucine-polyethylenimine; SD, standard deviation; h, hour.
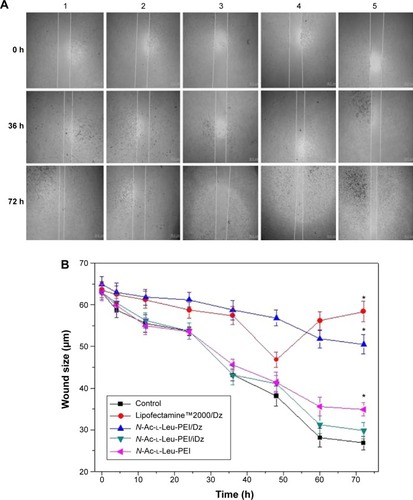
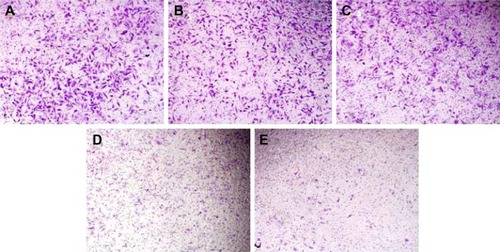
Figure 11 Effects of DNAzyme transfection on the cell migration using Transwell migration assay: (A) no treatment; (B) N-Ac-l-Leu-PEI; (C) N-Ac-l-Leu-PEI/iDz; (D) Lipofectamine™2000/Dz; and (E) N-Ac-l-Leu-PEI/Dz.
Abbreviation: N-Ac-l-Leu-PEI, N-acetyl-l-leucine-polyethylenimine.