Figures & data
Figure 1 Photographs of the GO and GO-Ag dispersions (50 µg mL−1) (A). UV-vis absorption spectra of GO and GO-Ag dispersions (B). XRD patterns of GO and GO-Ag nanocomposite (C). Thermogravimetric curves of GO and GO-Ag (D).
Abbreviations: GO, graphene oxide; GO-Ag, graphene oxide-silver nanocomposite; XRD, X-ray diffraction; UV-vis, ultraviolet-visible.
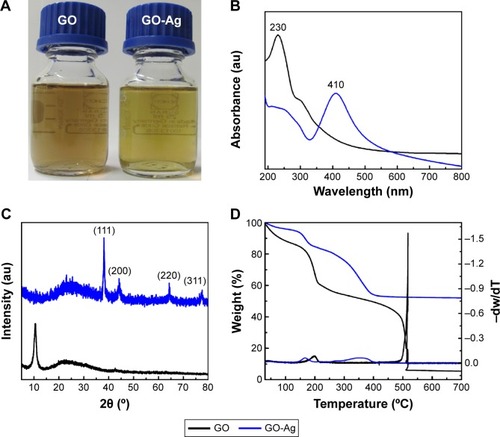
Figure 2 C 1s XPS spectra of GO (A) and GO-Ag (B).
Abbreviations: XPS, X-ray photoelectron spectroscopy; GO, graphene oxide; GO-Ag, graphene oxide-silver nanocomposite.
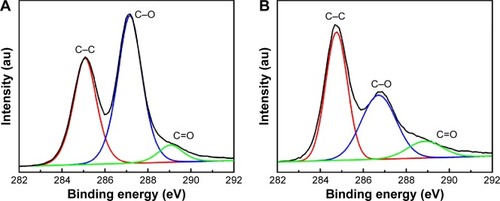
Figure 3 TEM images of GO (A), and GO-Ag sheets (B, C). Size distribution of AgNPs anchored to GO sheets (D). The size distribution was calculated by counting more than 500 nanoparticles in several GO-Ag images, using ImageJ software.
Abbreviations: TEM, transmission electron microscopy; GO, graphene oxide; GO-Ag, graphene oxide-silver nanocomposite; AgNPs, silver nanoparticles.
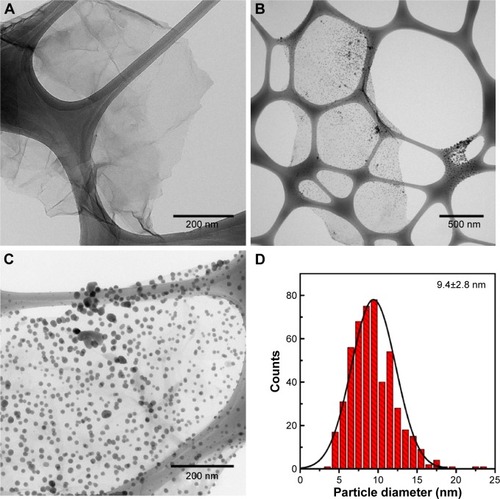
Table 1 Values of MICand MBCfor GO and GO-Ag against Gram-positive and Gram-negative bacteria
Table 2 Values of MIC and MBC for oxacillin and AgNPs against MRSA and Escherichia coli as model microorganisms
Figure 4 Time-kill curves of Gram-negative Escherichia coli ATCC 25922 (A), and Gram-positive MRSA N315 (B).
Note: Error bars represent the standard deviations of three replicates (n=3).
Abbreviations: MRSA, methicillin-resistant Staphylococcus aureus; h, hours; CFU, colony-forming units; GO, graphene oxide; GO-Ag, graphene oxide-silver nanocomposite.

Figure 5 TEM images of Escherichia coli cells not exposed to GO-Ag nanocomposite (A, B); and E. coli cells treated with 15 µg·mL−1 GO-Ag for 2 h (C–F). The cell membranes were found to be disrupted after contact with GO-Ag. The disruption of the bacterial cell and subsequent leaking of intracellular contents are highlighted by red arrows in C–F.
Abbreviations: TEM, transmission electron microscopy; GO-Ag, graphene oxide-silver nanocomposite; h, hours.
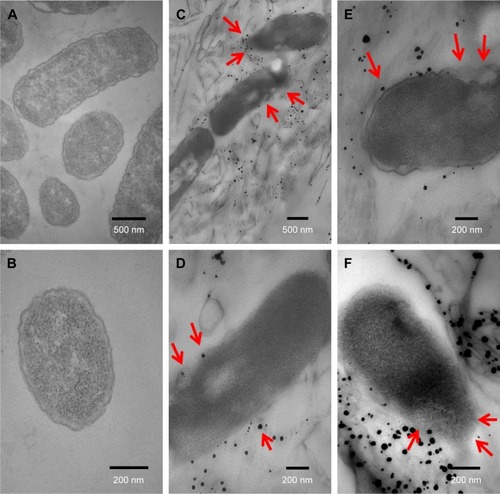
Figure 6 TEM images of MRSA cells not exposed to GO-Ag nanocomposite (A, B); and MRSA cells treated with 15 µg·mL−1 GO-Ag for 2 h (C–F). The cell membranes were severely damaged after exposure to GO-Ag. Visible damage on the cell surface is indicated by red arrows (C–F).
Abbreviations: MRSA, methicillin-resistant Staphylococcus aureus; TEM, transmission electron microscopy; GO-Ag, graphene oxide-silver nanocomposite; h, hours.
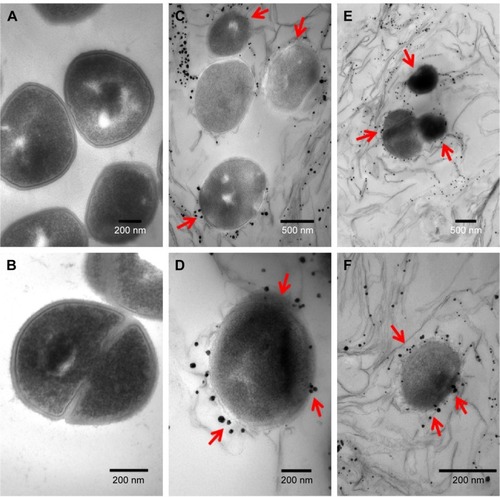
Figure S1 Ag 3d XPS spectrum of GO-Ag nanocomposite.
Abbreviations: XPS, X-ray photoelectron spectroscopy; GO, graphene oxide.
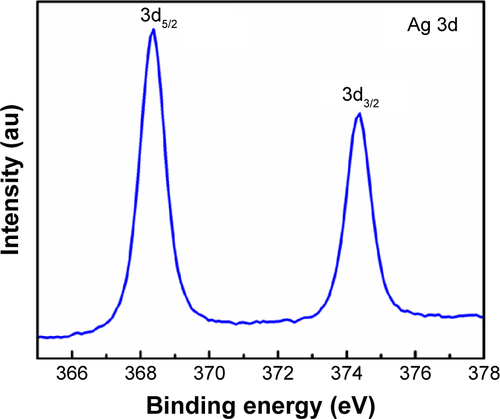
Figure S2 XPS survey spectra of GO and GO-Ag nanocomposite.
Note: (C 1s-carbon and O 1s-oxygen).
Abbreviations: XPS, X-ray photoelectron spectroscopy; GO, graphene oxide.
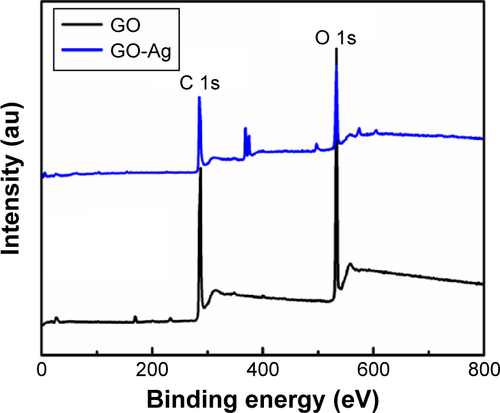
Figure S3 FTIR spectra of GO and GO-Ag nanocomposites.
Abbreviations: FTIR, Fourier transform infrared; GO, graphene oxide.
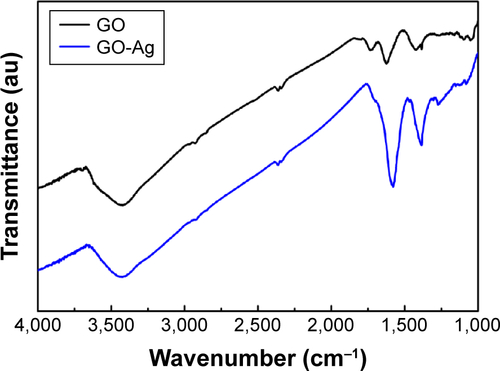
Figure S4 Raman spectra of GO and GO-Ag nanocomposites.
Abbreviation: GO, graphene oxide.
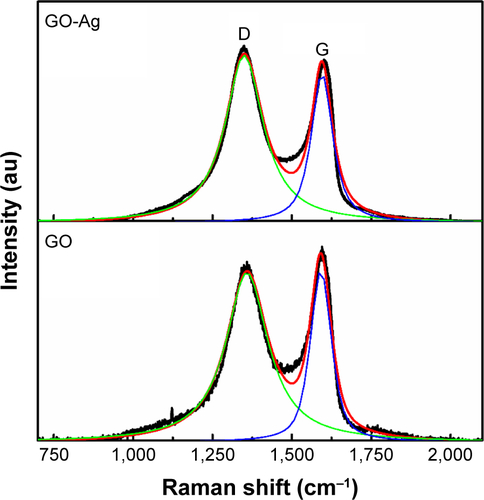
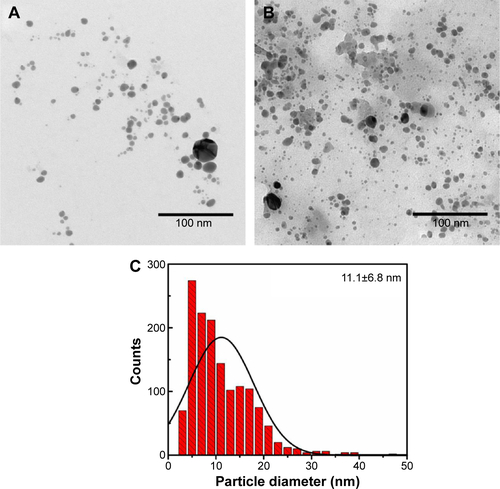
Figure S5 UV-vis absorption spectrum of bare AgNPs.
Abbreviations: UV-vis, ultraviolet-visible; AgNPs, silver nanoparticles.
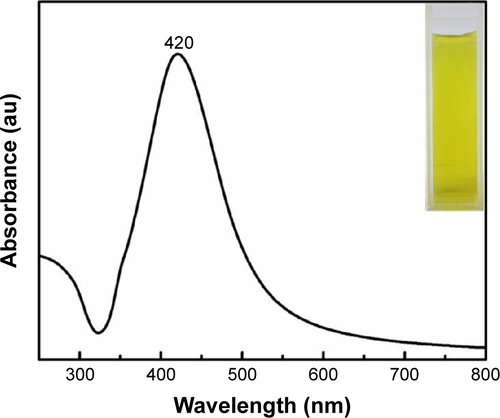
Figure S6 (A) and (B), TEM images of bare AgNPs. (C) Particle size distribution of AgNPs. The size distribution was calculated by counting more than 500 nanoparticles in several AgNP images, using ImageJ software.
Abbreviations: TEM, transmission electron microscopy; AgNPs, silver nanoparticles.