Figures & data
Table 1 Applicable ranges and optimized values of operational parameters for preparing chitosan electrospinning nanofibers
Figure 1 An animal model of bone defects.
Notes: Male C57LB/L mice were anesthetized, and a metaphyseal bone defect was drilled in the proximal femur (A). After rinsing in phosphate-buffered saline and subsequent exposure to ultraviolet light for 30 minutes, chitosan nanofiber scaffolds were implanted into the bone defect (B). The wound was sutured, and the animals were allowed free unrestricted weight-bearing after recovery from anesthesia. Only one defect was created in each proximal femur of an animal, and totally nine animals were treated in this study. Arrows indicate the bone defect sites.
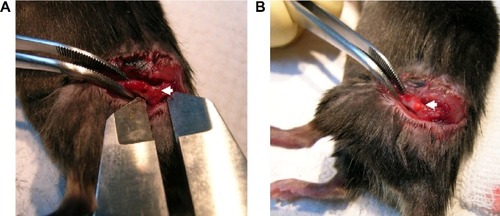
Figure 2 Preparation of electrospun chitosan nanofibers.
Notes: Chitosan at 50 mg/mL (A), 60 mg/mL (B), 70 mg/mL (C), and 80 mg/mL (D) was separately dissolved in the electrospinning solutions and electrospun into different chitosan nanofibers. The surface morphologies of these electrospun chitosan nanofibers were observed and photographed using scanning electron microscopy at 5,000×.
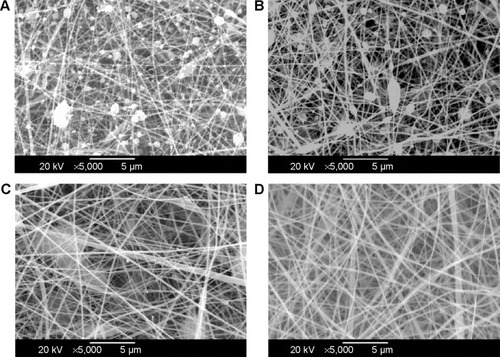
Figure 3 Toxicities of chitosan nanofibers to the liver and kidneys.
Notes: Bone defects were surgically created in the proximal femurs of male C57LB/L mice, and chitosan nanofibers were implanted into one defect for 21 days. After that period, animals were sacrificed, and the liver and kidneys were removed, cleaned, and weighed. These samples were fixed with paraformaldehyde and embedded in paraffin. Following slicing, liver (A) and kidney (B) specimens prepared from control (left panels) and chitosan nanofiber-treated (right panels) animals were stained with hematoxylin and eosin and observed and photographed under a light microscope at 200×. Only one defect was created in each proximal femur of an animal, and totally nine animals were treated in this study.
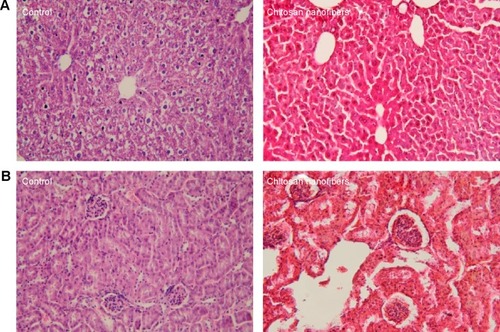
Figure 4 Effects of chitosan nanofiber scaffolds on trabecular bone production.
Notes: Bone defects were surgically created in the proximal femurs of male C57LB/L mice, and chitosan nanofibers were implanted into one defect for 21 days. After that period, animals were sacrificed, and the femurs were collected for analysis by μCT. The X-ray transmission images (A) and trabecular bone images (B) of the bone defects (red circles) in control and chitosan nanofiber scaffold-treated femurs are shown. Only one defect was created in each proximal femur of an animal, and totally nine animals were treated in this study.
Abbreviation: μCT, microcomputed tomography.
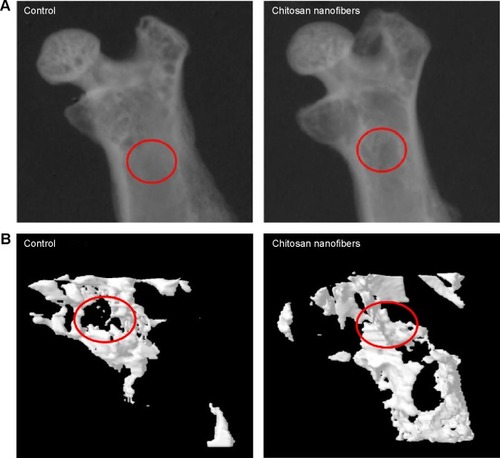
Figure 5 Improved effects of chitosan nanofiber scaffolds on bone healing.
Notes: Bone defects were surgically created in the proximal femurs of male C57LB/L mice, and chitosan nanofibers were implanted into one defect for 21 days. Only one defect was created in each proximal femur of an animal. After that period, animals were sacrificed, and the femurs were collected for analysis by μCT. The trabecular bone number (A), trabecular bone thickness (B), and trabecular parameter factor (C) were calculated and statistically analyzed. Each value represents the mean ± SEM for n=9. *Indicates that values significantly differed from the respective control, P<0.05.
Abbreviations: μCT, microcomputed tomography; SEM, standard error of mean.
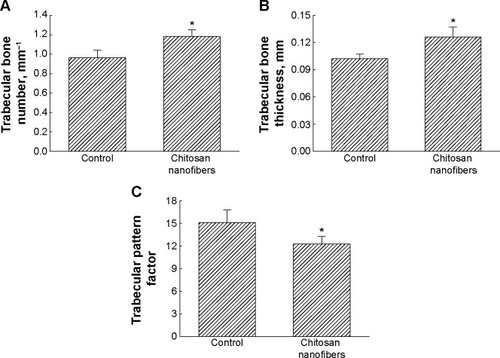
Figure 6 Effects of chitosan nanofiber scaffolds on bone healing using bone histomorphometry.
Notes: Bone defects were surgically created in the proximal femurs of male C57LB/L mice, and chitosan nanofibers were implanted into one defect for 21 days. After that period, animals were sacrificed, and the femurs were collected for a histological analysis. After removing the muscle and connective tissues, the femurs were decalcified, fixed, embedded in paraffin, and then sliced. These specimens were stained with hematoxylin and eosin. The stained signals were observed and photographed under a light microscope. Thin arrows indicate new bone areas, and thick arrows designate areas where the scaffolds were located. Only one defect was created in each proximal femur of an animal, and totally nine animals were treated in this study.
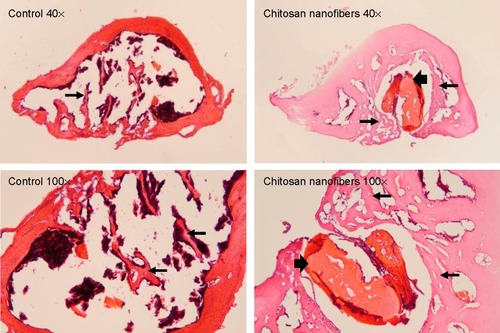
Figure 7 Effects of chitosan nanofiber scaffolds on levels of the transcriptional factor, Runx2, in bone defects.
Notes: Bone defects were created in the proximal femurs of male C57LB/L mice, and chitosan nanofibers were implanted into one defect for 21 days. Only one defect was created in each proximal femur of an animal. After that period, animals were sacrificed, and the femurs were collected for an immunohistological analysis of Runx2. After removing the muscle and connective tissues, the femurs were decalcified, fixed, embedded in paraffin, and then sliced. Levels of Runx2 were immunodetected by confocal microscopy (A). The fluorescent signals were quantified and statistically analyzed (B). Each value represents the mean ± SEM for n=9. *Indicates that values significantly differed from the respective control, P<0.05.
Abbreviations: Runx2, Runt-related transcription factor 2; SEM, standard error of mean.
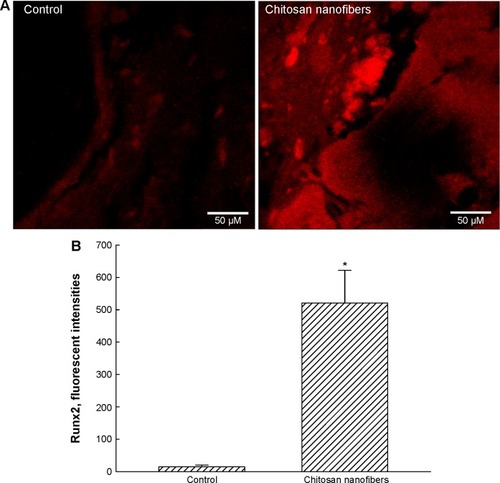
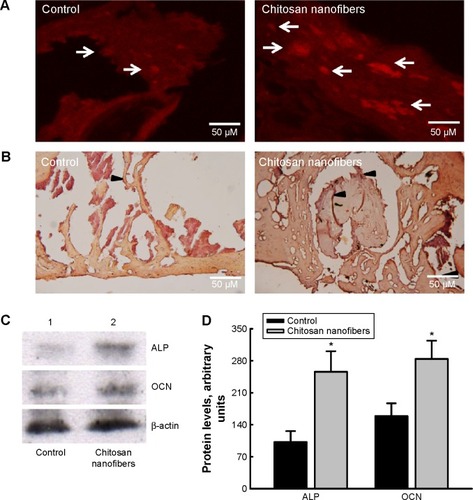
Figure 8 Effects of chitosan nanofibers on expressions of ALP and OCN in bone defects.
Notes: Bone defects were surgically created in the proximal femurs of male C57LB/L mice, and chitosan nanofiber scaffolds were implanted into one defect for 21 days. Only one defect was created in each proximal femur of an animal. After that period, animals were sacrificed, and the femurs were collected for immunohistological analyses of ALP (A) and OCN (B). Arrows/arrowheads indicate expressions of ALP and OCN. Proteins were prepared from control and chitosan nanofiber-treated femurs for immunoblotting analyses of ALP and OCN (C, top two panels). Amounts of β-actin were analyzed as the internal controls (bottom panel). These protein bands were quantified and statistically analyzed (D). Each value represents the mean ± SEM for n=6. *Indicates that values significantly differed from the respective control, P<0.05, 200×.
Abbreviations: ALP, alkaline phosphatase; OCN, osteocalcin; SEM, standard error of mean.