Figures & data
Figure 1 Size distribution by intensity of PAMAM/ANS nanoparticles (a and b) and Zeta potential graphs of different N/P ratios of PAMAM G3 (
 ), and G5 (▪) in 5% dextrose (c). Fixed concentrations of 500 nM of ANS in 5% dextrose were mixed with different generations of PAMAM at N/P ratio of 10 a). Part a) shows all size distributions at the same intensity scale in one graph. A peak of larger aggregates of G2/ANS nanoparticles can be observed in part a). Nanoparticles of various N/P ratios of PAMAM G5 which were formulated in 5% dextrose are shown in part b). In part c), the represented data are means of two (without error bar) or three (mean ± SD) measurements.
Abbreviations: PAMAM, poly(amidoamine) dendrimer; SD, standard deviation; ANS, antisense oligonucleotide.
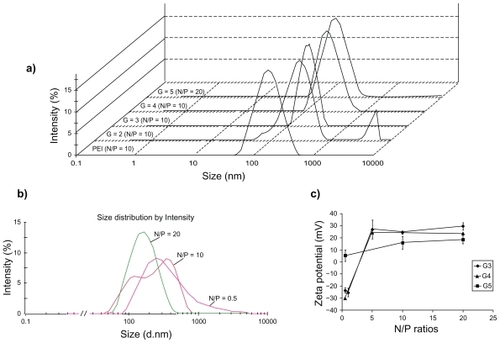
Table 1 Size distribution of nanoparticles determined by AFM and PCS methods. For AFM, n particles in different images were measured by the software of the device and then expressed as mean ± SD
Figure 2 AFM phase or topographic images and their corresponding surface profile of the selected section. The charge ratios were as 0.5 A), 5 B), 10 C), and 20 D).
Abbreviation: AFM, atomic force microscopy.
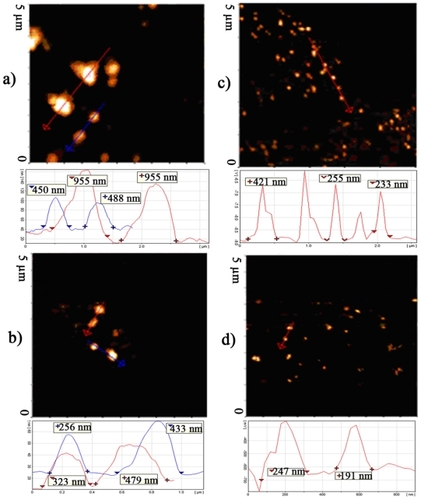
Figure 3 PAGE analysis of PAMAM G5/ANS nanoparticles carried out at various N/P ratios shown in the image.
Abbreviations: PAMAM, poly(amidoamine) dendrimer; ANS, antisense oligonucleotide; PAGE, polyacrylamide gel electrophoresis
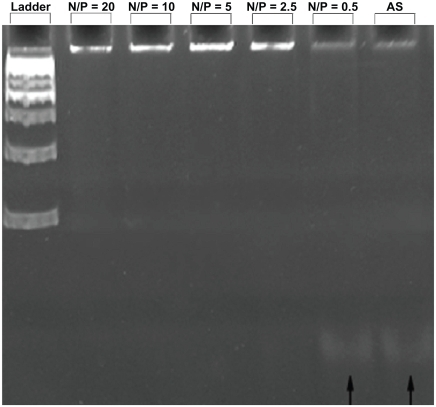
Figure 4 T47D cells uptake of PAMAM G5/FITC-ANS nanoparticles at charge ratios of 0.5 b), 10 c), 20 d), in comparison with the FITC-ANS alone a). The magnification of each image was 400X.
Abbreviations: PAMAM, poly(amidoamine) dendrimer; ANS, antisense oligonucleotide.
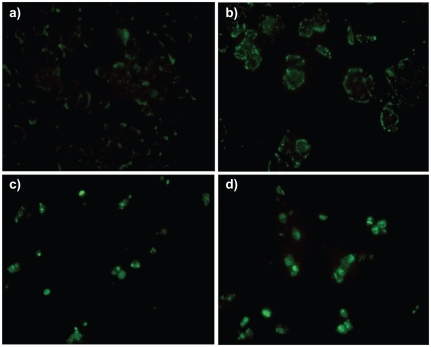
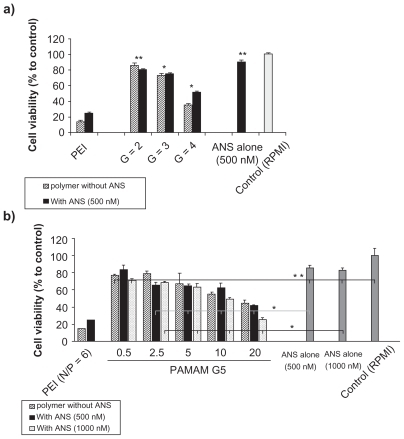
Figure 5 MTT assay graphs of PAMAM/ANS nanoparticles. In Figure 5a, multiple generations of PAMAM at fixed a N/P ratio of 10 (black filled columns) are compared with their corresponding PAMAM concentration without ANS (hatched columns), polyethyleneimine (PEI) at N/P ratio of 6, and negative control of FBS-free RPMI.
Abbreviations: PAMAM, poly(amidoamine) dendrimer. ANS, antisense oligonucleotide; N/P, PAMAM, primary amino groups to ANS phosphate groups; FBS, fetal bovine albumin; PEI, polyethyleneimine.
Figure 5b shows PAMAM G5 at different charge ratios of 0.5, 2.5, 5, 10, and 20. Their cytotoxicity was evaluated at two different concentrations of 500 nM (black filled columns) and 1000 nM (dotted columns) and also in comparison with their corresponding dendrimer concentrations without ANS (hatched columns). The PEI (N/P of 6) and naked ANS (500 nM) were positive and FBS-free RPMI was negative controls. All represented data are means of eight different measurements relative to the negative control (RPMI) ± standard error of mean. *was significantly different when each treatment was compared with the ANS alone concentration treatment (t-test, P value < 0.05). **No statistical difference (One-way ANOVA or Student t-test, P value ≥ 0.05).
Abbreviations: PAMAM, poly(amidoamine) dendrimer; ANS, antisense oligonucleotide; N/P, PAMAM, primary amino groups to ANS phosphate groups; FBS, fetal bovine albumin; PEI, polyethyleneimine; ANOVA, analysis of variance.