Figures & data
Figure 1 Reaction schemes to prepare targeted PLGA NP.
Notes: (A) Carbodiimide method, where EDC/sulfo-NHS was used as the cross-linker. COOH terminated PLGA reacts with EDC/sulfo-NHS to form NHS-ester that reacts with antibody to obtain a stable amide bond. (B) Using BS3 spacer, where covalent amide bond is formed between ligand and BS3 molecules embedded on pre-activated NPs’ surface. This method is applicable for both ester and COOH terminated PLGA NPs.
Abbreviations: PLGA, poly(d, l-lactide co-glycolide); NP, nanoparticle; EDC, carbodiimide hydrochloride; NHS, N-hydroxysuccinimide; COOH, carboxylic acid; BS3, bis(sulfo-succinimidyl) suberate.
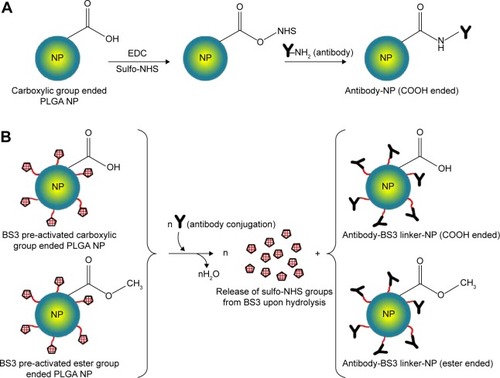
Table 1 Variable parameters considered to prepare the NPs
Table 2 Particle size, PDI, and ZP, and antibody loading for anti-CD205 modified NPs (n=4)
Figure 2 Particle size, PDI, and ZP of NPs prepared with different PLGA polymer end groups and viscosities following method 1.
Notes: The bar diagram and line plots represent particle size and PDI value, respectively. (A) Represents the NP formulations prepared without cryoprotectant. (B) Represents the same formulations preserved with two different cryoprotectants namely sucrose and trehalose. (C) Represents the comparative ZP of all NP formulations with or without cryoprotectant. The level of significance was set to P<0.05 (one-way ANOVA followed by Tukey’s multiple comparison test method). Each bar and line represents mean ± SD (n=12). C = COOH ended PLGA; E = ester ended PLGA, S = sucrose (10%); T = trehalose (10%).
Abbreviations: PDI, polydispersity index; ZP, zeta potential; NP, nanoparticle; PLGA, poly(d, l-lactide co-glycolide); ANOVA, analysis of variance; SD, standard deviation; COOH, carboxylic acid; FD, freeze-drying.
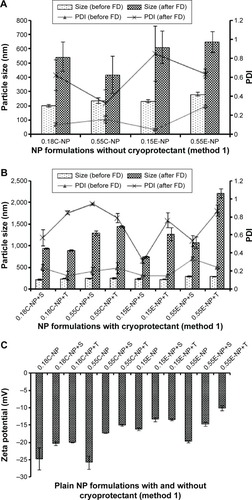
Figure 3 Particle size, PDI, and ZP of NPs prepared with different PLGA polymer end groups and viscosities following method 2.
Notes: The bar diagram and line plots represent particle size and PDI value, respectively. (A) Represents all the NP formulations with or without BS3 prepared without cryoprotectant. (B) Represents the same formulations preserved with sucrose (10%) as cryoprotectant. (C) Represents the comparative ZP of all NP formulations with or without cryoprotectant. The level of significance was set to P<0.05 (one-way ANOVA followed by Tukey’s multiple comparison test method). Each bar and line represents mean ± SD (n=12). C = COOH ended PLGA; E = ester ended PLGA; S = sucrose (10%).
Abbreviations: PDI, polydispersity index; ZP, zeta potential; NP, nanoparticle; PLGA, poly(d, l-lactide co-glycolide); ANOVA, analysis of variance; SD, standard deviation; COOH, carboxylic acid; FD, freeze-drying; BS3, bis(sulfo-succinimidyl) suberate.

Figure 4 SEM images.
Notes: SEM images of NPs (A) 0.15 iv ester terminated PLGA NPs at magnification of 30.84 KX at EHT (extra high tension) 25 kV; (B) antibody modified 0.15 iv ester terminated PLGA NPs at magnification of 78.75 KX at EHT 25 kV.
Abbreviations: SEM, scanning electron microscopy; NPs, nanoparticles; PLGA, poly(d, l-lactide co-glycolide); iv, inherent viscosity; Mag, magnification.
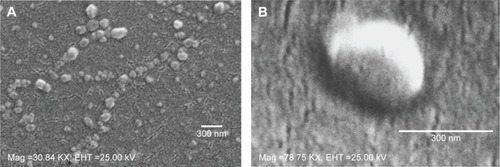
Figure 5 Infrared spectrum of NPs.
Notes: Primary (A) and secondary derivative (B) of IR spectrum for 0.55C-NP (0.55 iv COOH terminated plain PLGA NPs) (blue), 0.55C-NP+BS3 (BS3 containing 0.55 iv COOH terminated PLGA NPs) (red), and 0.55C-NP+BS3+anti-CD205 antibody (BS3 containing 0.55 iv COOH terminated Ab modified PLGA NPs) (black). Data are represented in absorbance unit versus wavelength (cm−1).
Abbreviations: IR, infrared; NP, nanoparticle; COOH, carboxylic acid; PLGA, poly(d, l-lactide co-glycolide); BS3, bis(sulfo-succinimidyl) suberate; iv, inherent viscosity; Ab, anti-CD205 antibody.
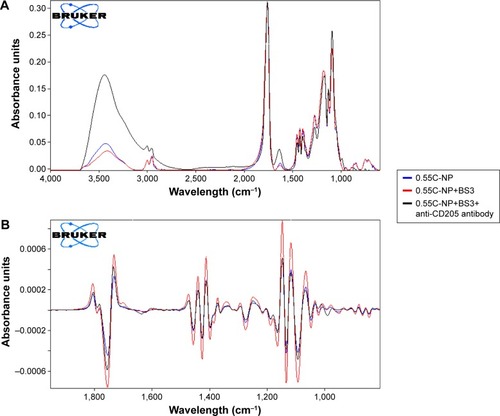
Figure 6 DC viability (MTT assay) after 24 hours of exposure to plain and antibody modified NPs (method 1).
Notes: The treated NP concentration was 1 mg/mL for cell density of 10,000. Result was calculated based on the absorbance of treated cells in comparison with untreated cells, where blank values were subtracted from each group (n=3). C = COOH ended PLGA, E = ester ended PLGA, S = sucrose (10%), and T = trehalose (10%).
Abbreviations: DC, dendritic cell; MTT, 3-(4, 5-dimethylthiazol-2-yl)-2, 5-diphenyltetrazolium bromide; NPs, nanoparticles; COOH, carboxylic acid; PLGA, poly(d, l-lactide co-glycolide).
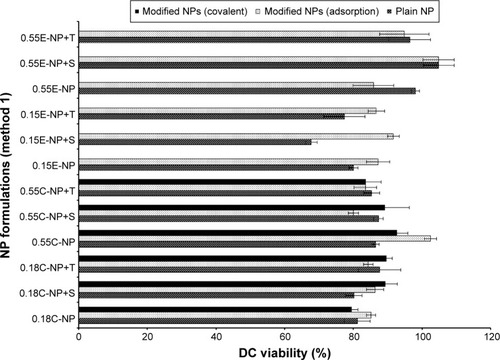
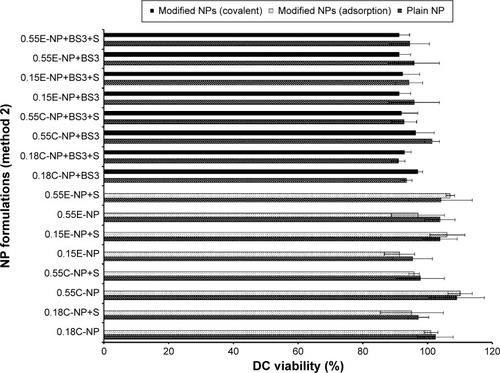
Figure 7 DC viability (MTT assay) after 24 hours of exposure to plain and modified NPs (method 2).
Notes: The treated NP concentration was 1 mg/mL for cell density of 10,000. Result was calculated based on the absorbance of treated cells in comparison with untreated cells, where blank values were subtracted from each group (n=3). C = COOH ended PLGA, E = ester ended PLGA, and S = sucrose (10%).
Abbreviations: DC, dendritic cell; MTT, 3-(4, 5-dimethylthiazol-2-yl)-2, 5-diphenyltetrazolium bromide; NPs, nanoparticles; COOH, carboxylic acid; PLGA, poly(d, l-lactide co-glycolide).