
Figures & data
Figure 1 IC50s of AERL inhibiting platelet aggregation induced by PAF, ADP, AA, and TH.
Notes: Aspirin was the positive control. n=6.
Abbreviations: AA, arachidonic acid; ADP, adenosine diphosphate; AERL, aqueous extract of Rabdosia rubescens leaves; PAF, platelet-activating factor; SD, standard deviation; TH, thrombin; IC50, half maximal inhibitory concentration.
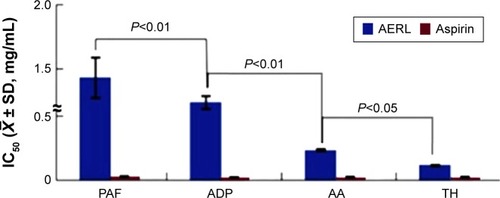
Figure 2 Thrombus weights of rats orally receiving AERL and rosmarinic acid.
Notes: (A) Thrombus weights of rats orally receiving AERL. (B) Thrombus weights of rats orally receiving rosmarinic acid. Aspirin was the positive control. n=10.
Abbreviations: AERL, aqueous extract of Rabdosia rubescens leaves; NS, normal saline; SD, standard deviation.
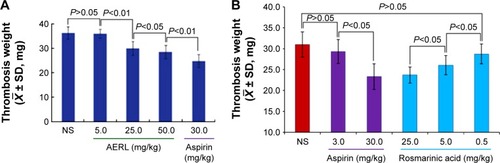
Figure 3 Effect of AERL on the in vitro release of sP-selectin from platelets.
Notes: IQCA was the reference compound. n=4.
Abbreviations: AERL, aqueous extract of Rabdosia rubescens leaves; IQCA, 3S-tetrahydroisoquinoline-3-carboxylic acid; NS, normal saline; SD, standard deviation; sP-selectin, soluble P-selectin.
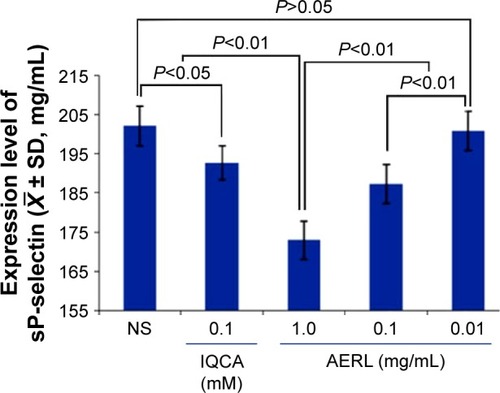
Figure 4 TEM and AFM images showing the nanostructure of the lyophilized solids of AERL in water and rat plasma.
Notes: (A) TEM image of nanoparticles of AERL in water, 4.5–63.6 nm in diameter (concentration, 1.0 mg/mL). (B) TEM image of nanoparticles of AERL in water, 32.9–180.8 nm in diameter (concentration, 0.5 mg/mL). (C) TEM image of nanoparticles of AERL in water, 38.9–227.8 nm in diameter (concentration, 0.25 mg/mL). (D) TEM image of nanoparticles of AERL in water, 45.7–234.3 nm in diameter (concentration, 0.12 mg/mL). (E) AFM image of nanoparticles of AERL in rat plasma, 53–159 nm in diameter (concentration, 0.5 mg/mL). Two red arrowheads indicate the diameter of the nanoparticle. (F) AFM image of nanostructure of rat plasma alone.
Abbreviations: AERL, aqueous extract of Rabdosia rubescens leaves; AFM, atomic force microscopy; TEM, transmission electron microscopy.
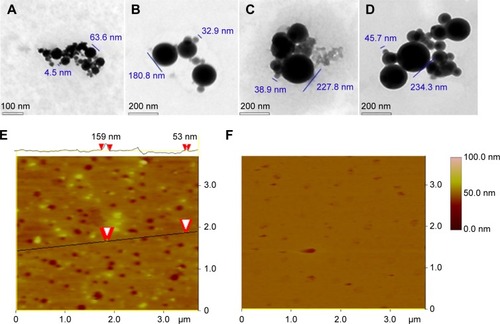
Figure 5 HPLC–PDA 3D chromatogram of AERL and docking feature of rosmarinic acid in the active site of P-selectin.
Notes: (A) Docking feature of rosmarinic acid in the active site of P-selectin. (B) HPLC–PDA 3D chromatogram of AERL (20.34% in whole extract, calculated from HPLC analysis, 254 nm).
Abbreviations: AERL, aqueous extract of Rabdosia rubescens leaves; AU, absorbance unit; HPLC, high-performance liquid chromatography; PDA, photodiode array detector; min, minutes.
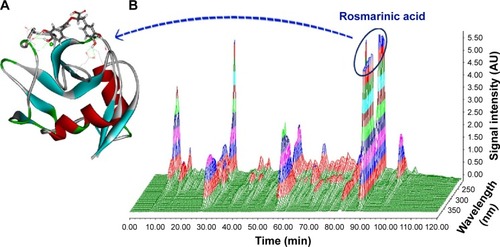
Figure 6 Depression of P-selectin expression by rosmarinic acid.
Notes: (A) Unlabeled platelets (background). (B) PE-anti-CD62P-labeled platelets. (C) PE-anti-CD62P-labeled and AA-activated platelets without rosmarinic acid. (D) PE-anti-CD62P-labeled and AA-activated platelets with 1 μM of rosmarinic acid. P2, a high fluorescence intensity area in which there is no fluorescence in NS group.
Abbreviations: AA, arachidonic acid; NS, normal saline; PE, phycoerythrin.
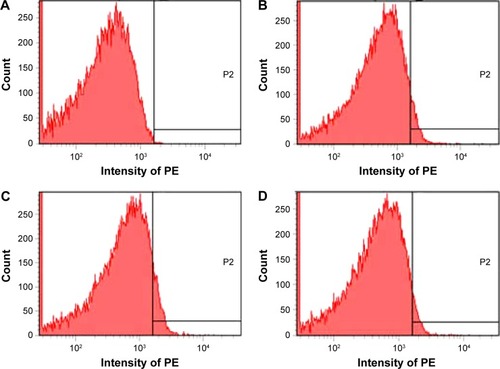
Figure S1 1H NMR of rosmarinic acid.
Notes: (A) 1H NMR of rosmarinic acid; (B) enlarged image of 1H NMR of rosmarinic acid. 1H NMR (500 MHz, MeOD): δ/ppm =7.54 (d, J=15.5 Hz, 1H), 7.03 (d, J=2 Hz, 1H), 6.94 (dd, J=8.0 Hz, 2.0 Hz, 1H), 6.77 (d, J=8.0 Hz, 1H), 6.74 (d, J=2.0 Hz, 1H), 6.69 (d, J=8.5 Hz, 1H), 6.60 (dd, J=8.0 Hz, 2.0 Hz, 1H), 6.26 (d, J=15.5 Hz, 1H), 5.18 (d, J=8.5 Hz, 4.5 Hz, 1H), 3.09 (dd, J=14.5 Hz, 4.5 Hz, 1H), 3.00 (dd, J=14.5 Hz, 8.5 Hz, 1H).
Abbreviations: NMR, nuclear magnetic resonace; H, hydrogen.
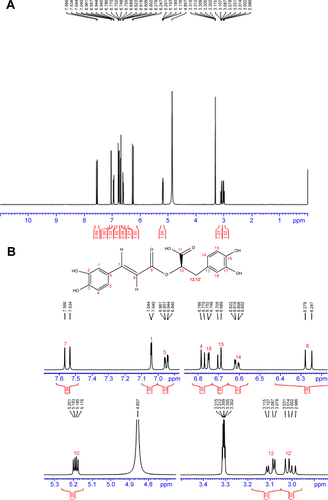
Figure S2 13C NMR of rosmarinic acid.
Notes: 13C NMR (125 MHz, MeOD): δ/ppm =172.04 (C11), 167.05 (C9), 148.33 (C3), 146.33 (C2), 145.41 (C17), 144.77 (C7), 143.89 (C16), 127.87 (C13), 126.28 (C6), 121.74 (C5), 120.41 (C14), 116.19 (C4), 115.11 (C18), 114.91 (C8), 113.85 (C15), 113.03 (C1), 73.19 (C10), 36.52 (C12).
Abbreviations: NMR, nuclear magnetic resonace; C, carbon.
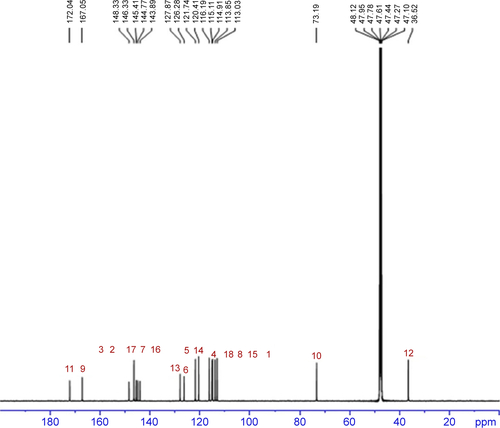
Figure S3 Faraday–Tyndall effect, zeta potential, and size of AERL in pH 7.0 and pH 2.0 water.
Notes: (A) 0.5 mg/mL of AERL. (B) 15 mg/mL of AERL. (C) Distilled water. (D) Size (a) and zeta potential (b) of AERL in pH 7.0 water (0.5 mg/mL). (E) Size (a) and zeta potential (b) of AERL in pH 2.0 water (0.5 mg/mL).
Abbreviations: AERL, aqueous extract of Rabdosia rubescens leaves; SD, standard deviation.
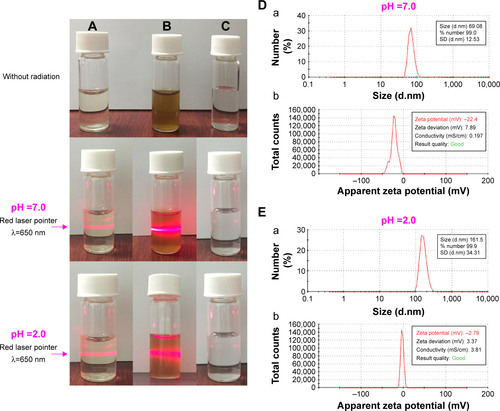
Table S1 Thirty peaks and (−)ESI-MS/MS spectrum assigned structures