Figures & data
Figure 1 Chemical structure of genistein.
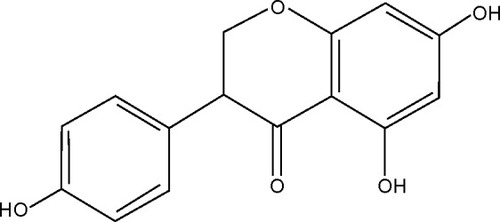
Figure 2 Schematic illustration of structures of micelles, micellar emulsions, and emulsions.

Figure 3 Quantification of Gen by UPLC-QTOF/MS.
Notes: (A) Representative chromatograms for quantification of Gen by UPLC-QTOF/MS. (B) The extracted ion chromatogram of Gen in plasma.
Abbreviations: Gen, genistein; MS, mass spectroscopy; QTOF, quadrupole time of flight; UPLC, ultra performance liquid chromatography.
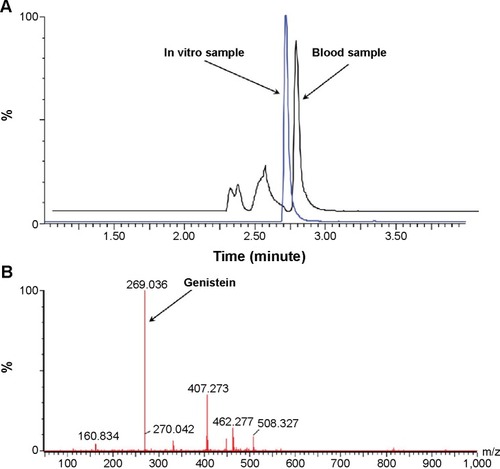
Figure 4 Formulation screening of Gen-MEs.
Notes: The effects of MCT/mPEG-PCL ratio (A), drug/mPEG-PCL ratio (B), and organic/aqueous phase volume ratio upon injection (C) on particle size as well as PDI of Gen-MEs (n=3, mean ± SD).
Abbreviations: Gen-MEs, genistein-loaded micellar emulsions; MCT, medium-chain triglycerides; mPEG-PCL, methoxy poly(ethylene glycol)-block-(ε-caprolactone); PDI, polydispersity index.
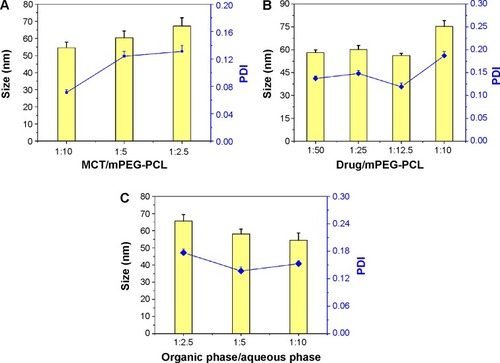
Figure 5 Characterization of Gen-MEs.
Notes: (A) Particle size distribution; (B) morphology of Gen-MEs observed by TEM.
Abbreviations: Gen-MEs, genistein-loaded micellar emulsions; TEM, transmission electron microscopy.
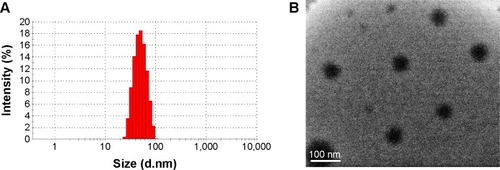
Figure 6 Release curves of Gen-MEs and Gen-micelles performed in pH 7.4 medium based on an equilibrium dialysis method (n=3, mean ± SD).
Abbreviations: Gen, genistein; Gen-MEs, Gen-loaded micellar emulsions.
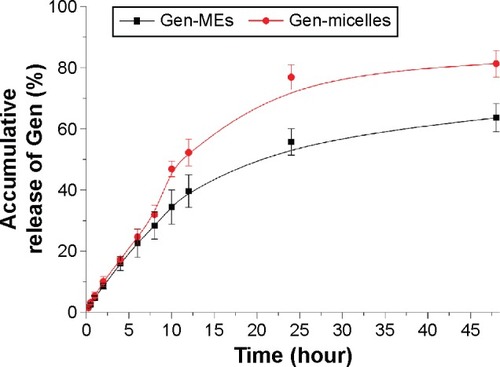
Figure 7 The stability of Gen-MEs characterized by particle size distribution.
Notes: A short-term (1 week) stability investigation on storage performed at 4°C (A) and 25°C (B); physical changes in appearance for Gen-MEs and Gen-micelles after 1 week of preparation (C); the physiological stability in the blood estimated with pH 7.4 SBF (D).
Abbreviations: Gen, genistein; Gen-MEs, Gen-loaded micellar emulsions; SBF, simulated body fluid.
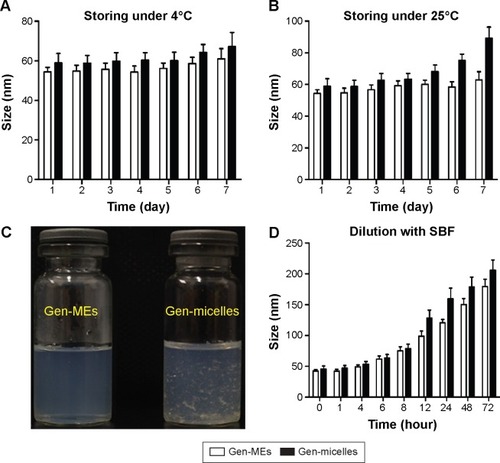
Table 1 List of pharmacokinetic parameters derived by fitting the conventional two-compartment model to the plasma data
Figure 8 Plasma Gen concentration vs time profiles after intravenous administration of Gen-MEs, Gen-micelles, and Gen solution to rats (mean ± SD, n=5).
Abbreviations: Gen, genistein; Gen-MEs, Gen-loaded micellar emulsions.
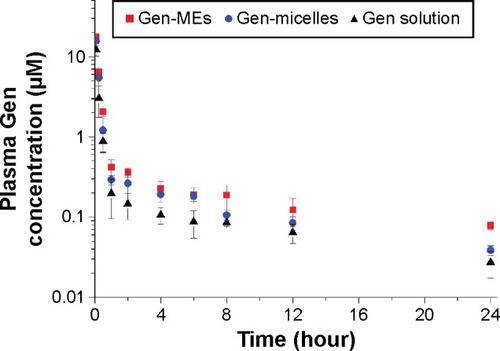
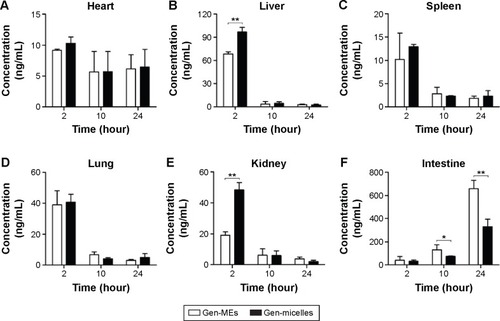
Figure 9 Tissue distribution of Gen after intravenous administration of Gen-MEs and Gen-micelles at 2, 10, and 24 hours.
Notes: Student’s t-test, **P<0.01, compared with Gen-micelles.
Abbreviations: Gen, genistein; Gen-MEs, Gen-loaded micellar emulsions.