Figures & data
Figure 1 Scheme of the experimental groups.
Abbreviations: SeNPs, selenium nanoparticles; STZ, streptozotocin.
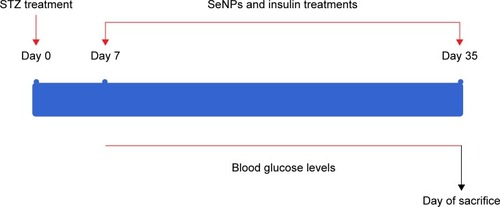
Figure 2 Size characterization of SeNPs by DLS and TEM.
Notes: The upper insert is the magnified TEM image of SeNPs. Scale bar =100 nm.
Abbreviations: DLS, dynamic light scattering; SeNPs, selenium nanoparticles; TEM, transmission electron microscope.
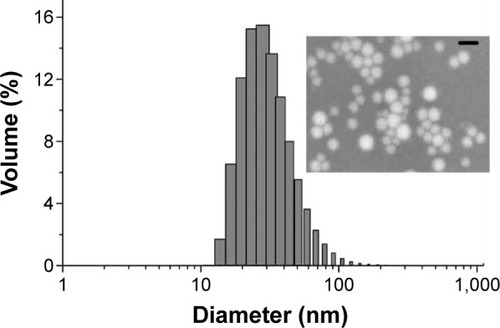
Table 1 Changes in body weight of different groups
Figure 3 (A) Effect of SeNPs on selenium concentration in the liver, kidney, and intestine of control and experimental groups. (B) Effect of SeNPs and insulin on glutathione peroxidase activity in the liver and kidney of control and experimental groups.
Notes: Values are mean ± standard error of the mean (n=7). aP<0.05, significant change with respect to control group; bP<0.05, significant change with respect to diabetic group.
Abbreviations: Ins, insulin; SeNPs, selenium nanoparticles; STZ, streptozotocin.
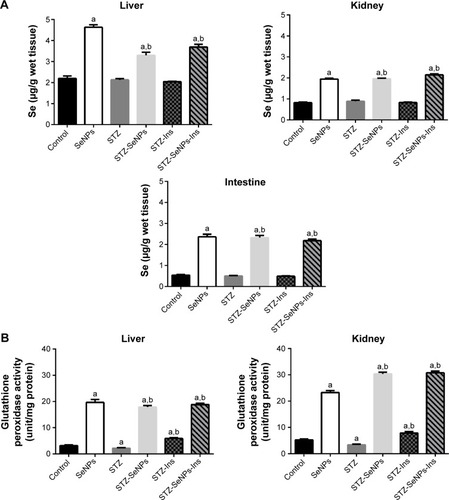
Figure 4 Effect of SeNPs and insulin on the blood glucose levels over 28 days in control and experimental groups.
Note: Values are mean ± standard error of the mean (n=7).
Abbreviations: Ins, insulin; SeNPs, selenium nanoparticles; STZ, streptozotocin.
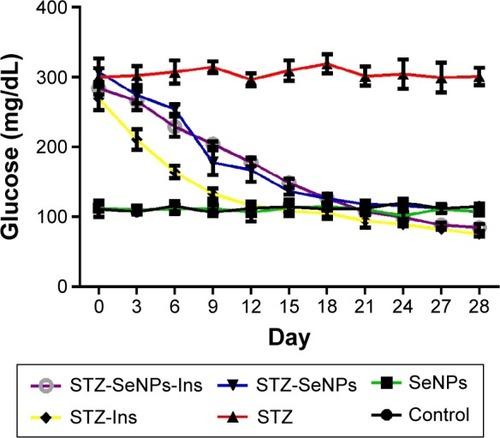
Figure 5 Effect of SeNPs and insulin on the blood serum insulin level of control and experimental groups.
Notes: Values are mean ± standard error of the mean (n=7). aP<0.05, significant change with respect to control group; bP<0.05, significant change with respect to diabetic group.
Abbreviations: Ins, insulin; SeNPs, selenium nanoparticles; STZ, streptozotocin.
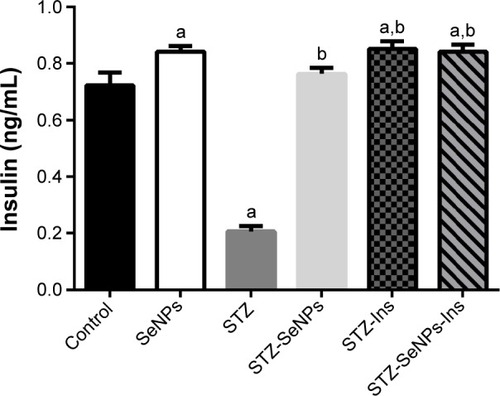
Table 2 Serum ALT, AST, ALP, total bilirubin, uric acid, urea, and creatinine of the studied groups
Figure 6 (A) Effect of SeNPs and insulin on carbohydrate metabolism enzyme activities in the liver and kidney of control and experimental groups. (B) Effect of SeNPs and insulin on glycogen contents in the liver and kidney of control and experimental groups.
Notes: Values are mean ± standard error of the mean (n=7). aP<0.05, significant change with respect to control group; bP<0.05, significant change with respect to diabetic group.
Abbreviations: Ins, insulin; SeNPs, selenium nanoparticles; STZ, streptozotocin.
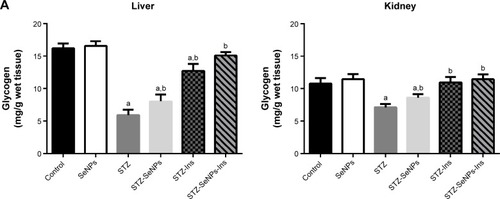
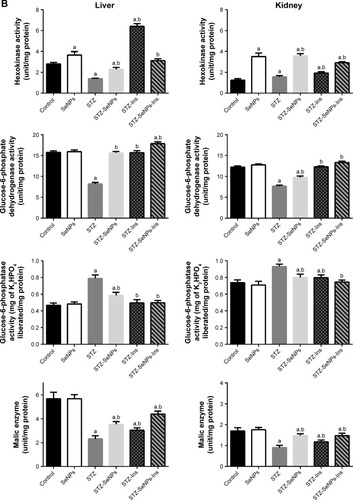
Table 3 Effect of SeNPs and insulin on lipid profile in serum of control and experimental groups
Figure 7 Effect of SeNPs and insulin on hepatic mRNA expression of candidate genes in control and experimental groups.
Notes: Results (mean ± standard error of the mean of three assays) were normalized to β-actin RNA level and are shown as fold induction (in log 2 scale) relative to the mRNA level in the control. aP<0.05, significant change with respect to control group; bP<0.05, significant change with respect to STZ group for Duncan’s post hoc test.
Abbreviations: FAS, fatty acid synthase; G6PD, glucose-6-phosphate dehydrogenase; GK, glucokinase; HK, hexokinase; Ins, insulin; IR, insulin receptor; IRS1, insulin receptor substrate 1; LpL, lipoprotein lipase; PIK3R2, phosphoinositide-3-kinase, regulatory subunit 2 (beta); PK, pyruvate kinase; SeNPs, selenium nanoparticles; STZ, streptozotocin.
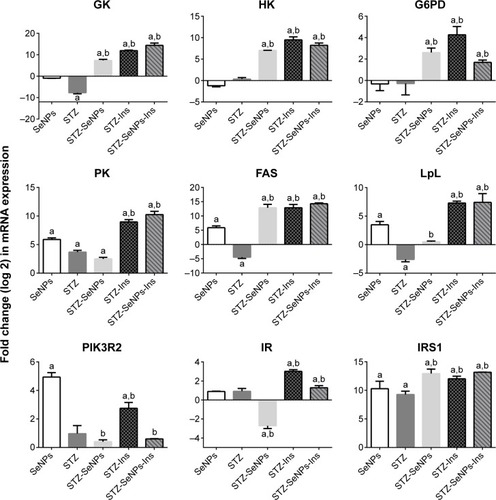
Figure 8 Effect of SeNPs and insulin on renal mRNA expression of candidate genes in control and experimental groups.
Notes: Results (mean ± standard error of the mean of three assays) were normalized to β-actin RNA level and are shown as fold induction (in log 2 scale) relative to the mRNA level in the control. aP<0.05, significant change with respect to control group; bP<0.05, significant change with respect to STZ group for Duncan’s post hoc test.
Abbreviations: FAS, fatty acid synthase; G6PD, glucose-6-phosphate dehydrogenase; GK, glucokinase; HK, hexokinase; Ins, insulin; IR, insulin receptor; IRS1, insulin receptor substrate 1; LpL, lipoprotein lipase; PIK3R2, phosphoinositide-3-kinase, regulatory subunit 2 (beta); PK, pyruvate kinase; SeNPs, selenium nanoparticles; STZ, streptozotocin.
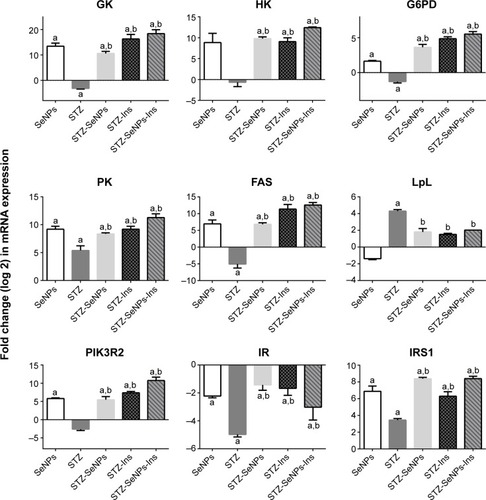
Figure 9 Histology of the pancreas.
Notes: (A) Control group, showing normal cells in the islet of Langerhans. (B) SeNP-treated group, showing normal cells in the islet of Langerhans. (C) STZ group, shrunken islets of Langerhans displaying degenerative and necrotic changes in diabetic rats, in addition, there are delicate collagen fibers around the islets of Langerhans. (D) STZ-SeNP-treated group, SeNPs protected the majority of cells in the islet of Langerhans. (E) STZ-Ins-treated group, insulin protected the majority of cells in the islet of Langerhans; however, the diameter of the islet of Langerhans is small. (F) STZ-SeNPs-Ins-treated group, SeNPs and insulin protected the majority of cells in the islet of Langerhans. Sections stained with hematoxylin and eosin. Scale bar =50 μm.
Abbreviations: Ins, insulin; SeNPs, selenium nanoparticles; STZ, streptozotocin.
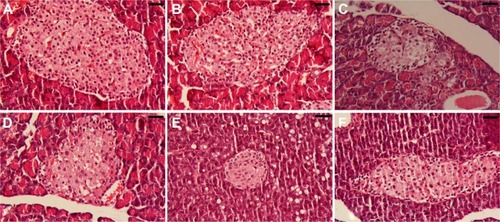
Figure 10 Histology of the liver.
Notes: (A) Control group, showing normal portal triad along with normal hepatocytes with a central vein. (B) SeNP-treated group, showing normal portal triad along with normal hepatocytes with a central vein. (C) STZ group, showing hepatic vein congestion, invasion of inflammatory cells, variability in the nuclear size, and mild fat deposition. (D) STZ-SeNP-treated group, SeNPs treatment showing arranged hepatocytes. (E) STZ-Ins-treated group, insulin treatment protected the majority of hepatocytes. (F) STZ-SeNPs-Ins-treated group, SeNPs and insulin treatment showing normal portal triad along with normal hepatocytes with central vein. Sections stained with hematoxylin and eosin. Scale bar =50 μm.
Abbreviations: Ins, insulin; SeNPs, selenium nanoparticles; STZ, streptozotocin.
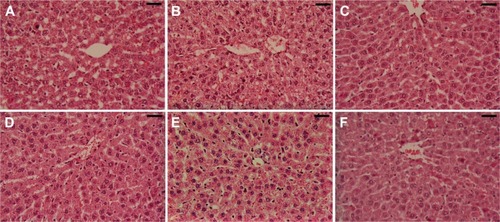
Figure 11 Histology of the kidney.
Notes: (A) Control group, showing normal glomeruli with normal baseline and tubules. (B) SeNP-treated group, showing normal glomeruli with normal baseline and tubules. (C) STZ group, showing shrunken or completely lost glomeruli, intratubular blood congestion, loss of glomerular lobulation tubular cytoplasmic vacuolation, and some pyknotic nucleus. (D) STZ-SeNP-treated group, SeNPs improved the glomeruli with no infiltration of lymphocytes. (E) STZ-Ins-treated group, insulin treatment showing normal glomeruli with no infiltration of lymphocytes. (F) STZ-SeNPs-Ins-treated group, SeNPs, and insulin showing normal glomeruli with no infiltration of lymphocytes and with improved structure of tubules. Sections stained with hematoxylin and eosin. Scale bar =50 μm.
Abbreviations: Ins, insulin; SeNPs, selenium nanoparticles; STZ, streptozotocin.
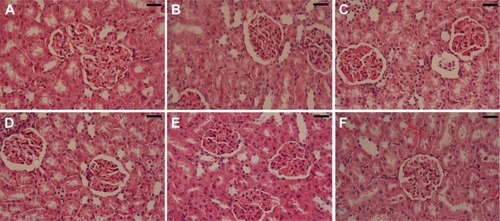
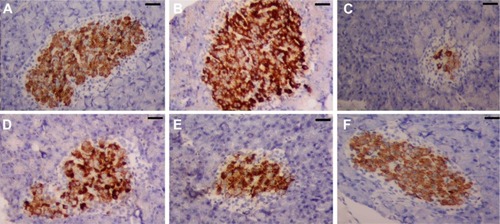
Figure 12 Rat pancreas stained with insulin antibody.
Notes: (A) Control group, showing β-cells in the islet of Langerhans that are strongly stained with the anti-insulin antibody. (B) SeNPs group, showing β-cells in the islet of Langerhans that are very strongly stained with the anti-insulin antibody. (C) STZ group, weak insulin-immunoreactivity is observed in a few β-cells in the islet of Langerhans in diabetic rats. (D) STZ-SeNP-treated group, SeNPs has protected the majority of β-cells in the islet of Langerhans, and strong staining with the anti-insulin antibody is shown. (E) STZ-Ins-treated group, insulin has protected the few of β-cells in the islet of Langerhans, and moderate staining with the anti-insulin antibody is shown. (F) STZ-SeNPs-Ins-treated group, SeNPs, and insulin has protected the majority of β-cells in the islet of Langerhans, and strong staining with the anti-insulin antibody. Scale bar =50 μm.
Abbreviations: Ins, insulin; SeNPs, selenium nanoparticles; STZ, streptozotocin.