Figures & data
Figure 1 Pseudo-ternary phase diagrams of the novel nanoemulsion adjuvant vaccine.
Notes: (A) Smix =2:1. (B) Smix =3:1. (C) Smix =4:1. (D) Smix =5:1. The green areas represent the region of the nanoemulsion formation.
Abbreviations: IPM, isopropyl myristate; Smix, ratio of surfactant and co-surfactant.

Figure 2 The average size and zeta potential change in response to different amounts of the adding protein.
Notes: (A) Average size change in response to different addition amounts. (B) Zeta potential change in response to different addition amounts. (C) Average size change in response to different addition orders. (D) Zeta potential change in response to different addition orders. Four addition orders: HSCO represents protein, surfactant, co-surfactant, and oil; SHCO represents surfactant, protein, co-surfactant, and oil; SCHO represents surfactant, co-surfactant, protein, and oil; SCOH represents surfactant, co-surfactant, oil, and protein. *P<0.05 is considered as a difference; **P<0.01 is considered as a significant difference.
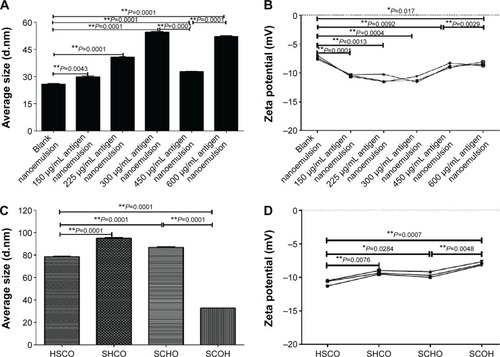
Figure 3 Physical characteristics of the novel nanoemulsion vaccine.
Notes: (A) Transmission electron micrograph. (B) Atomic force microscopy micrograph. (C) Size diameter and distribution. (D) Zeta potential and distribution. *The X and Y axes both have a total length of 420 nm and are broken up into 1,000 parts; every 100 parts is a unit and represents 42 nm. **The Z axis is measured as percentages (‘100’ represents 100% of the average height measured, and is defined as a standard; ‘200’ represents two times the average height).
Abbreviation: PRAH, percentage of relative average height.
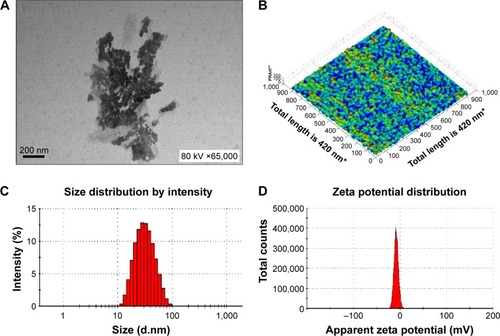
Figure 4 Physical stability of the novel nanoemulsion vaccine.
Notes: (A) Primary structural integrity of the antigen protein. (B) Structural specificity of the antigen protein. (C) Primary structural integrity after storage at different temperatures. (D) Stability after long-term storage. Blank nanoemulsion supernatant: lane 1; blank nanoemulsion precipitate: lane 2; blank nanoemulsion treatment supernatant: lane 3; blank nanoemulsion treatment precipitate: lane 4; prestained marker: lane 5; novel nanoemulsion vaccine supernatant: lane 6; novel nanoemulsion vaccine precipitate: lane 7; novel nanoemulsion vaccine treatment supernatant: lane 8; novel nanoemulsion vaccine treatment precipitate: lane 9; native protein agent: lane 10, in (A) and (B). Lanes 1, 4, and 7 represent the novel nanoemulsion vaccine stored at 4°C for 1, 2, and 3 months individual; lanes 2, 5, and 8 represent novel nanoemulsion vaccine stored at 25°C for 1, 2, and 3 months individual; lanes 3, 6, and 9 represent novel nanoemulsion vaccine stored at 40°C for 1, 2, and 3 months individual, and lane 10 represents prestained protein marker, in (C). Lane 1: prestained marker; lanes 2–10 represent novel nanoemulsion vaccine stored at room temperature for 0, 1, 2, 3, 4, 6, 8, 10, and 12 months in (D). The visibly clear protein lanes were marked by black squares. Black arrows indicate antigen protein.
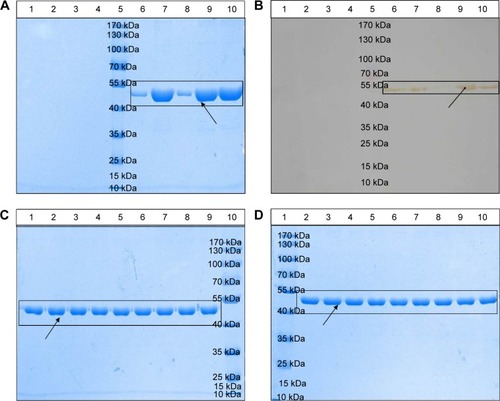
Figure 5 Specific IgG, IgG1, IgG2a, and IgG2b antibodies in the serum after intramuscular injection of the nanoemulsion vaccine.
Notes: (A) The IgG titer log2 value of the nanoemulsion. (B) The serum IgG1 optical density of the nanoemulsion vaccine at 450 nm. (C) The serum IgG2a optical density of the nanoemulsion vaccine at 450 nm. (D) The serum IgG2b optical density of the nanoemulsion vaccine at 450 nm. **P<0.01 is considered as a significant difference; *P<0.05 is considered as a difference.
Abbreviations: Ig, immunoglobulin; OD, optical density; PBS, phosphate-buffered saline; BNE, blank nanoemulsion.
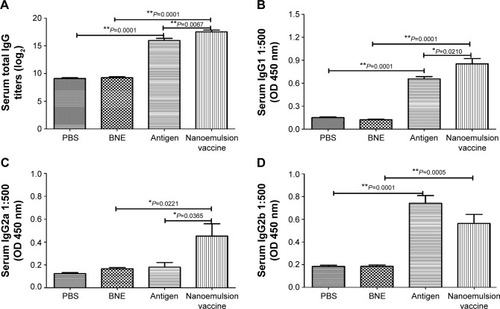
Figure 6 IgG1/IgG2a, IgA, IFN-γ, and IL-17A levels in response to an intramuscular injection of the nanoemulsion vaccine.
Notes: (A) IgG1/IgG2a ratio of the nanoemulsion vaccine. (B) Serum IgA optical density at 450 nm of the nanoemulsion vaccine. (C) Serum IFN-γ level in response to the nanoemulsion vaccine. (D) Serum IL-17A level in response to the nanoemulsion vaccine. **P<0.01 is considered as a significant difference; *P<0.05 is considered as a difference.
Abbreviations: Ig, immunoglobulin; IFN, interferon; IL, interleukin; PBS, phosphate-buffered saline; BNE, blank nanoemulsion; OD, optical density.
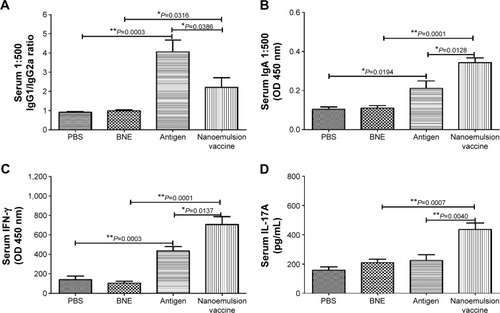
Figure 7 Specific IgG, IgG1, IgG2a, and IgG2b in the serum antibodies after the nasal mucosal administration of the nanoemulsion vaccine.
Notes: (A) The IgG titer log2 value of the nanoemulsion. (B) The serum IgG1 optical density of the nanoemulsion vaccine at 450 nm. (C) The serum IgG2a optical density of the nanoemulsion vaccine at 450 nm. (D) The serum IgG2b optical density of the nanoemulsion vaccine at 450 nm. **P<0.01 is considered as a significant difference; *P<0.05 is considered as a difference.
Abbreviations: Ig, immunoglobulin; PBS, phosphate-buffered saline; BNE, blank nanoemulsion; OD, optical density.
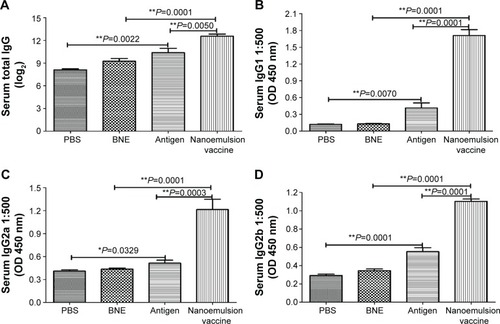
Figure 8 IgG1/IgG2a, IgA, IFN-γ, and IL-17A level in the serum after a nasal mucosal immune response.
Notes: (A) IgG1/IgG2a ratio of the nanoemulsion vaccine. (B) Serum IgA optical density of the nanoemulsion vaccine at 450 nm. (C) Serum IFN-γ production in response to the nanoemulsion vaccine. (D) Serum IL-17A production in response to the nanoemulsion vaccine. **P<0.01 is considered as a significant difference; *P<0.05 is considered as a difference.
Abbreviations: Ig, immunoglobulin; IFN, interferon; IL, interleukin; PBS, phosphate-buffered saline; BNE, blank nanoemulsion; OD, optical density.
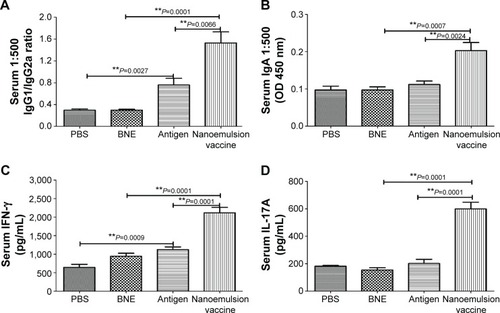
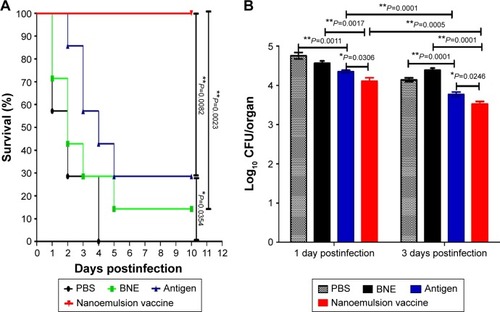
Figure 9 Survival ratio and bacterial challenge results.
Notes: (A) The survival ratio of Balb/c mice in response to systemic MRSA infection. (B) Lung bacterial burden of C57 mice infected with MRSA pneumonia. **P<0.01 is considered as a significant difference. *P<0.05 is considered as a difference.
Abbreviations: MRSA, methicillin-resistant Staphylococcus aureus; PBS, phosphate-buffered saline; BNE, blank nanoemulsion.