
Figures & data
Table 1 Sample of training data records indicating the composition and properties of CAR nanosuspensions
Table 2 ANOVA statistics obtained from model training and testing data sets
Table 3 ANOVA statistics obtained from model validation data sets
Figure 1 Response surface plots showing influence of some formulation variables on nanosuspension average particle size: (A) stabilizer type and wt of stabilizer; (B) ratio of hydrophilic to hydrophobic units and wt of stabilizer; (C) number of PPO units and wt of stabilizer; (D) drug/stab ratio and phase volume ratio.
Abbreviations: PS, particle size; PPO, polypropylene oxide; stab, stabilizer; Wt, weight.
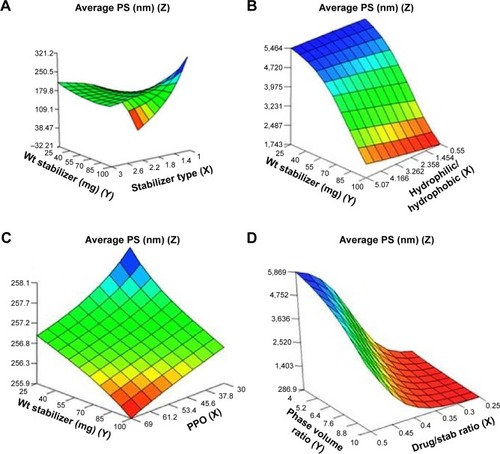
Figure 2 Response surface plots showing influence of some formulation variables on nanosuspension average polydispersity index: (A) number of PEO units and ratio of hydrophilic to hydrophobic units; (B) drug load and stabilizer type; (C) m.wt and stabilizer HLB; (D) phase volume ratio and water volume.
Abbreviations: PDI, polydispersity index; PEO, polyethylene oxide; m.wt, molecular weight; HLB, hydrophilic–lipophilic balance.
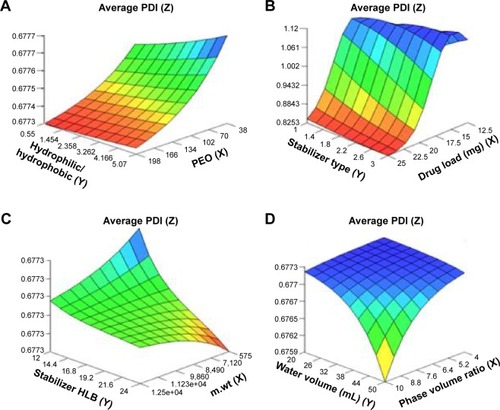
Figure 3 Response surface plots showing influence of some formulation variables on nanosuspension average zeta potential: (A) drug/stab ratio and ratio of hydrophilic to hydrophobic units; (B) drug load and stabilizer type; (C) number of PEO units and wt of stabilizer; (D) number of PPO units and wt of stabilizer.
Abbreviations: ZP, zeta potential; PPO, polypropylene oxide; PEO, polyethylene oxide; stab, stabilizer; Wt, weight.
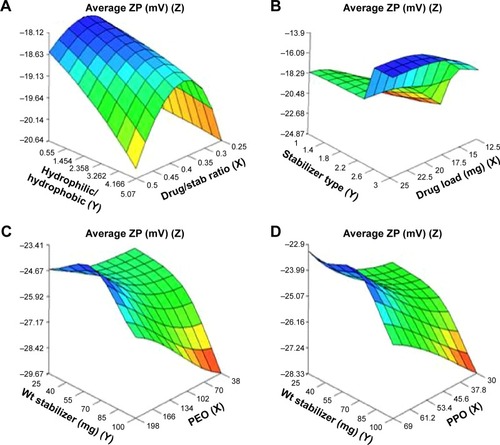
Table 4 Model-generated optimized solution and its analogous fresh and lyophilized experimental nanosuspensions
Figure 4 Transmission electron micrograph for the optimized carvedilol nanosuspension.
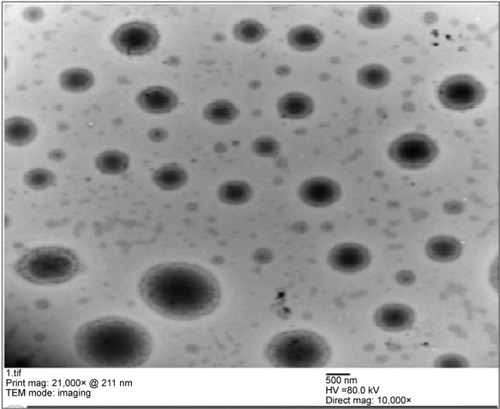
Figure 5 Scanning electron micrograph of freeze-dried nanosuspension showing dispersed spherical nanoparticles inside a crystalline matrix of cryoprotectant (red circle).
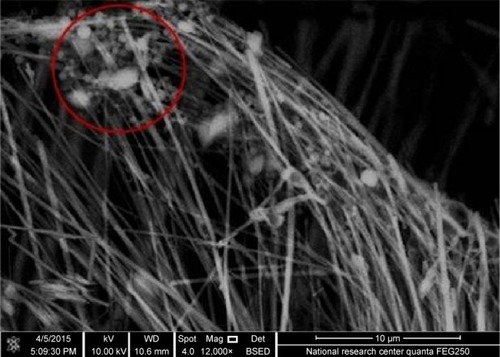
Figure 6 Differential scanning calorimetry (DSC) curves of carvedilol (CAR), Pluronic F127 (PL), sodium deoxycholate (SDC), mannitol (MN), physical mixture (PM), and lyophilized nanosuspension (NS).
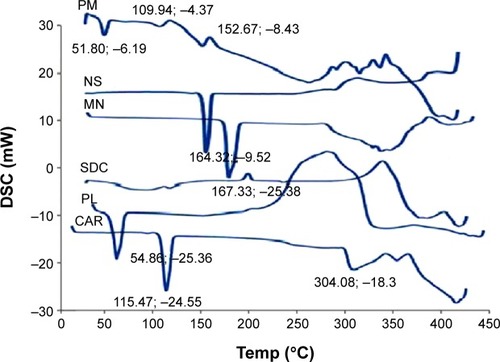
Figure 7 Powder X-ray diffraction patterns of carvedilol (CAR), Pluronic F127 (PL), sodium deoxycholate (SDC), mannitol (MN), physical mixture (PM), and lyophilized nanosuspension (NS).
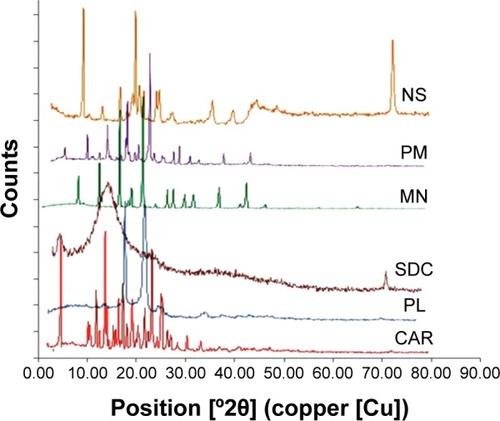
Figure 8 Percentage of CAR dissolved from optimized nanosuspension formula compared to the coarse drug.
Abbreviation: CAR, carvedilol.
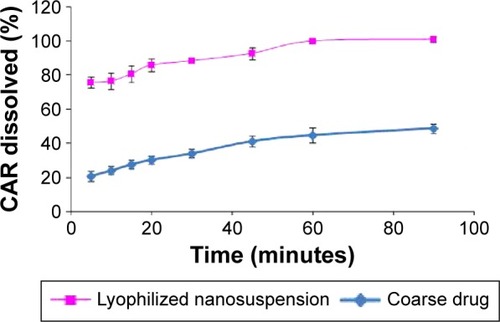
Table 5 The aerodynamic characteristics of coarse CAR powder and CAR nanoparticles