Figures & data
Table 1 Characterization of complex PC on AgNPs
Table 2 Hyperspectral comparison of intracellular and APF-incubated AgNPs
Figure 1 Hyperspectral analysis of AgNPs and the PC.
Notes: (A) Hyperspectral analysis characterizing differences in mean spectra of AgNPs with a diameter of 20 nm or 110 nm and suspended in either citrate or PVP. (B) Differences in mean spectra of AgNPs due to addition of a complex PC (10% fetal bovine serum) or an individual PC composed of BSA.
Abbreviations: NPs, nanoparticles; PVP, polyvinylpyrrolidone; PC, protein corona; BSA, bovine serum albumin.
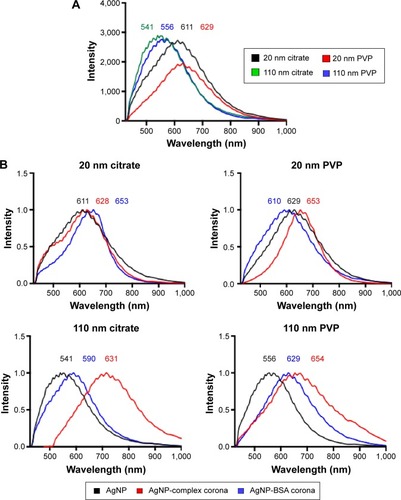
Figure 2 Representative enhanced darkfield images of macrophages exposed for 2 hours to AgNPs, AgNPs with a complex PC, or AgNPs with a BSA PC at a concentration of 25 µg/mL.
Note: The macrophage nucleus is stained with DAPI and appears blue within the image.
Abbreviations: NPs, nanoparticles; PC, protein corona; BSA, bovine serum albumin; DAPI, 4′,6-diamidino-2-phyenylindole; PVP, polyvinylpyrrolidone.
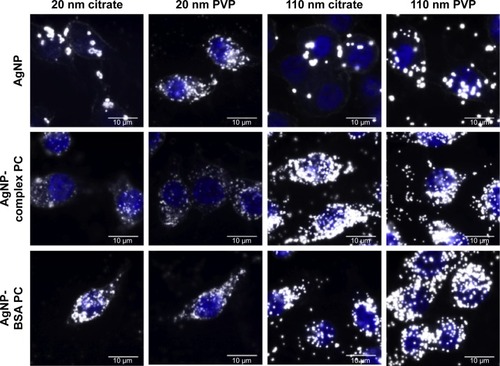
Figure 3 Comparison of mean spectra of agNPs and internalized agNPs.
Notes: Macrophages were exposed to agNPs, agNPs with a complex Pc, or agNPs with a Bsa Pc at a concentration of 25 µg/mL for 2 hours. Intracellular AgNPs were then identified, and spectra were averaged to produce mean spectra. Intracellular spectra (red) were then compared to initial AgNP spectra (blue).
Abbreviations: NPs, nanoparticles; PC, protein corona; BSA, bovine serum albumin; PVP, polyvinylpyrrolidone.
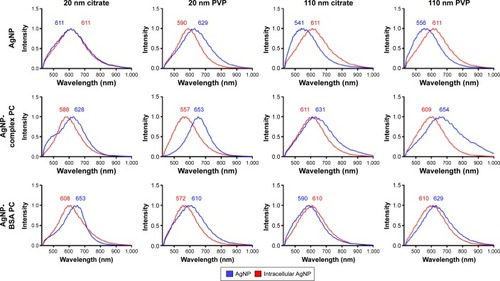
Figure 4 Time course of macrophage internalized in 110 nm PVP-suspended AgNPs.
Notes: Macrophages were exposed to AgNPs, AgNPs with a complex PC, or AgNPs with a BSA PC at a concentration of 25 µg/mL for 30 minutes. Following exposure, AgNPs were removed, and cells were washed and placed in media with serum. Spectra of internalized 110 nm AgNPs were assessed at 30 minutes, 2 hours, 6 hours, and 24 hours postexposure.
Abbreviations: PVP, polyvinylpyrrolidone; NPs, nanoparticles; PC, protein corona; BSA, bovine serum albumin; h, hours; min, minutes.
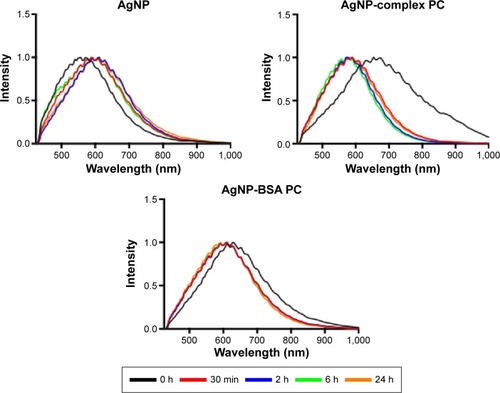
Figure 5 Measurement of AgNP uptake by assessment of changes in SSC via flow cytometry and ICP-MS.
Notes: Macrophages were exposed to AgNPs, AgNPs with a complex PC, or AgNPs with a BSA PC at a concentration of 25 µg/mL for 2 hours, and uptake was determined by (A) assessment of changes in SSC shift and (B) ICP-MS analysis of silver content. SSC values of cells exposed to AgNPs were normalized to serum-free media control cells to produce a fold change. Values are expressed as mean ± SEM (n=4–7 per group). *Significant difference from unexposed control cells (P<0.05). #Significant difference compared to AgNP without a PC (P<0.05).
Abbreviations: NP, nanoparticle; SSC, side scatter; ICP-MS, inductively coupled plasma-mass spectrometry; PC, protein corona; BSA, bovine serum albumin; SEM, standard error of mean; PVP, polyvinylpyrrolidone.
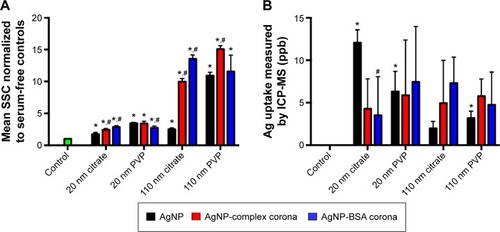
Figure 6 Assessment of macrophage activation.
Notes: Macrophages were exposed to AgNPs, AgNPs with a complex PC, or AgNPs with a BSA PC at a concentration of 25 µg/mL for 6 hours. Following exposure, macrophages were evaluated for changes in (A) mRNA expression of TNF-α and (B) protein levels of TNF-α. Values represent mean ± SEM (n=4–6 per group). *Significant difference from unexposed control cells (P<0.05). #Significant difference compared to AgNP without a PC (P<0.05).
Abbreviations: NPs, nanoparticles; PC, protein corona; BSA, bovine serum albumin; TNF-α, tumor necrosis factor-α; SEM, standard error of mean; PVP, polyvinylpyrrolidone.
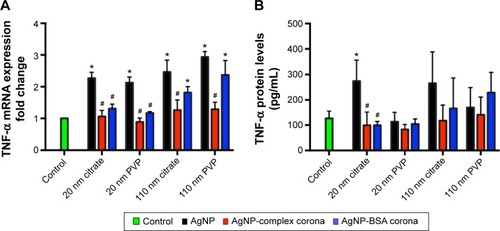
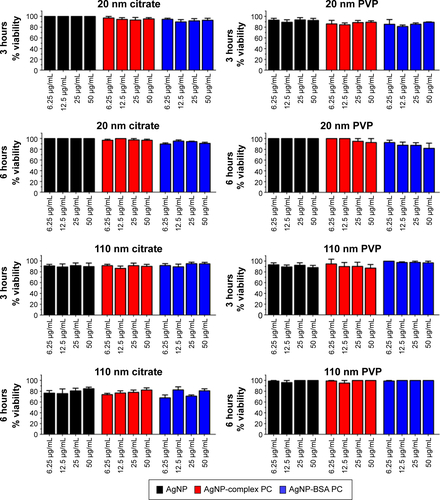
Figure S1 AgNP cytotoxicity response.
Abbreviations: NP, nanoparticle; PC, protein corona; BSA, bovine serum albumin; PVP, polyvinylpyrrolidone.