Figures & data
Figure 1 Detection of human IgG protein in an immunochemistry assay on protein G or epoxy slides.
Notes: (A) Typical structure of an antibody and its oriented positions that can affect binding affinity are illustrated. (B) Scheme of the different types of immobilization of antibodies on protein G or epoxy slides. Representative images of the fluorescence intensity of human IgG bound to the capture antibodies immobilized on either protein-G- or epoxy-terminated glass slides with decreasing concentration of the antigen (34–4.3 μg/mL).
Abbreviations: IgG, immunoglobulin G; Fab, fragment antigen-binding; Fc, fragment crystallizable.
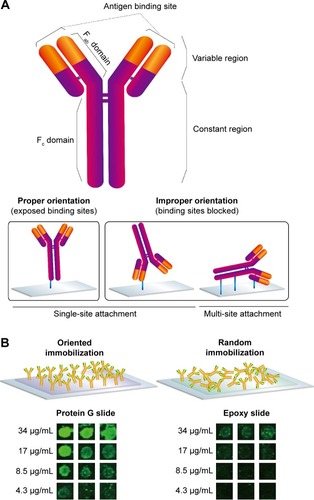
Figure 2 Detection of human cytokines on protein-G-coated glass slides.
Notes: (A) Recombinant human IL-2 spots on protein G slides were detected using a sandwich immunoassay. Various concentrations of IL-2 (50 ng/mL, 5 ng/mL, 500 pg/mL, 50 pg/mL, 5 pg/mL, and 0.5 pg/mL) were spotted onto both epoxy and protein G slides and detected using the corresponding fluorescently labeled antibody. (B) Comparison of the IL-2 fluorescence intensities on epoxy or protein G slides. (C) Recombinant human IFN-γ spots on protein G slides were detected by an immunoassay. (D) Comparison of the IFN-γ fluorescence intensities on epoxy or protein G slide.
Abbreviations: IL-2, interleukin-2; IFN, interferon.
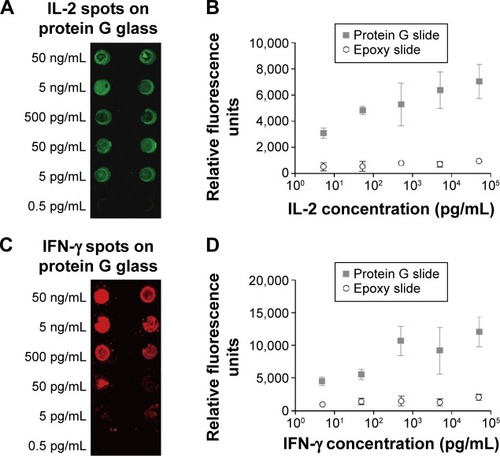
Figure 3 The detection of IgG proteins secreted from hybridomas in microwells.
Notes: (A) Schematic diagram of the microwell array used to capture cytokines secreted from viable hybridomas deposited onto an array (~20×50 mm2) consisting of 72×24 blocks that contain a 7×7 array of microwells. (B) Representative bright-field image of live hybridomas loaded into microwells at an average density of ~1–2 cells/well. The array was sealed with glass slides bearing a mixture of capture antibodies. After the incubation period, the glass slide was recovered and the bound proteins were detected using secondary antibodies. Both the protein-G-terminated glass slides (C) and the epoxy-based slides (D) were coated with anti-human antibodies (IgG) for the respective cytokines. The immunofluorescence images of a region of a microarray show captured IgG from hybridomas on each substrate.
Abbreviations: IgG, immunoglobulin G; PDMS, polydimethylsiloxane.
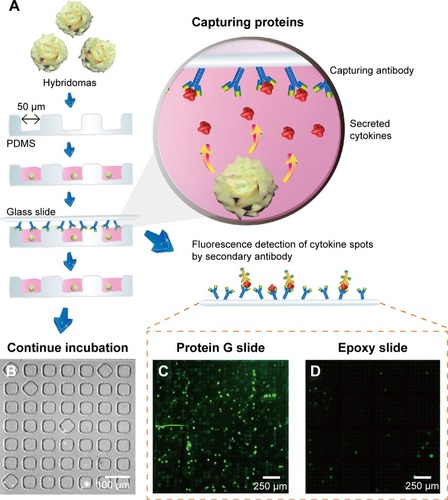
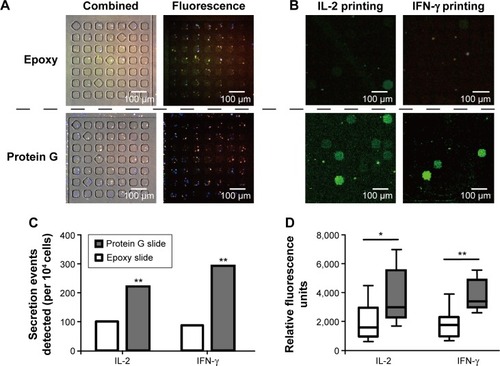
Figure 4 Detection of secreted cytokines (IL-2 and IFN-γ) from stimulated PBMCs in a microwell assay using two types of substrates.
Notes: Microwells were placed in contact with each glass slide coated with IL-2 or IFN-γ capture antibodies, respectively. After 1 hour, the glass slide was removed and incubated with secondary antibodies tagged with fluorescent molecules. (A) Combined fluorescence images of microwells, and (B) their printed glass slides on the same region capturing cell-secreted IL-2 or IFN-γ. Two different cytokines released by PBMCs on each substrate were detected by dye-conjugated secondary antibodies. (C) Comparison of the numbers of positive events detected per 10,000 cells for two cytokines on the epoxy-based slide (white boxes) or on the protein-G-terminated slide (gray boxes). Statistical significance was determined by Fisher’s exact test (**P<0.01). The data represent composite measurements from three separate microarrays generated in parallel using divided aliquots from the same pool of stimulated PBMCs. (D) Box and whisker plot comparing relative fluorescence units detected on the epoxy-based slide (white boxes) and on the protein-G-terminated slide (gray boxes) for two different proteins secreted from PBMCs. Statistical significances were determined by the Student’s t-test (*P<0.05, **P<0.01).
Abbreviations: IL-2, interleukin-2; IFN-γ, interferon-γ; PBMCs, peripheral blood mononuclear cells.