Figures & data
Figure 1 Schematic diagram of the apparatus used for solution-enhanced dispersion by supercritical fluids.
Notes: (A) 1, CO2 cylinder; 2, refrigerator; 3, high-pressure pump; 4, stabilization tank; 5, pressure sensor; 6, temperature sensor; 7, nozzle; 8, filter; 9, view vessel; 10, air bath; 11, high-pressure constant flow pump; 12, graduated flask; 13, separator; 14, wet gas meter. (B) The structure of the nozzle.
Abbreviations: P, pressure; T, temperature.
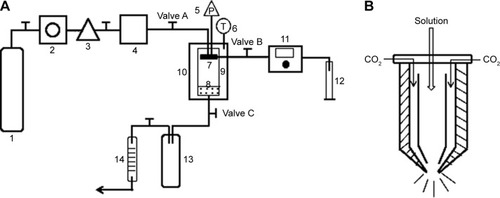
Table 1 Coded levels and measured responses for the 20 experiment formulation runs
Table 2 Comparison of the experimental and predicted values of SM-Lip-SEDS under predicted optimum conditions
Figure 2 Response surface models showing the influence of the factors on the responses.
Notes: Three-dimensional response surface plots showing the effects of (I) the ratio of silymarin to phospholipids, (II) flow rate of solution, and (III) pressure on the responses of Y1 (A), Y2 (B), and Y3 (C). Y1 is the response of the mean particle size. Y2 is the response of entrapment efficiency. Y3 is the response of drug loading.
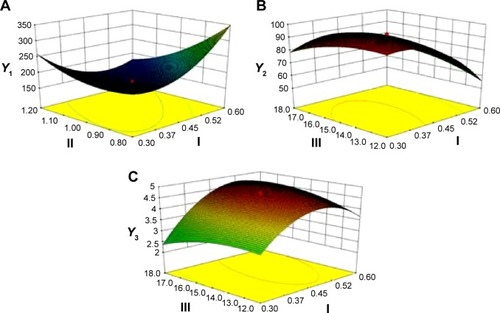
Figure 3 Size distribution, zeta potential, and transmission electron microscopic images of liposomes (Lip) prepared by the solution-enhanced dispersion supercritical fluids (SEDS), thin-film dispersion (TFD), and reversed-phase evaporation (RPE) methods.
Abbreviation: SM, silymarin.
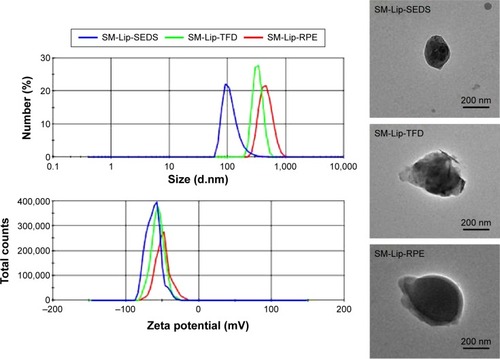
Figure 4 A comparison of entrapment efficiency and drug loading of liposomes prepared by different methods.
Notes: Entrapment efficiency (A) and drug loading (B) of liposomes prepared by the (a) thin-film dispersion method, (b) reversed-phase evaporation method, and (c) solution-enhanced dispersion by supercritical fluids (SEDS) method. *P<0.05 compared to SEDS (mean ± SD, n=3).
Abbreviation: SD, standard deviation.
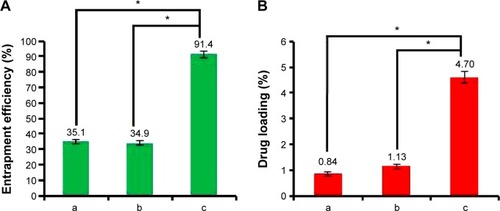
Figure 5 X-ray diffraction analyses of (A) silymarin, (B) sodium glycocholate, (C) hydrogenated soybean phosphatidylcholine, (D) soybean phosphatidylcholine, (E) physical mixture of SM, SGC, and phosphatidylcholines, and (F) SM liposomes.
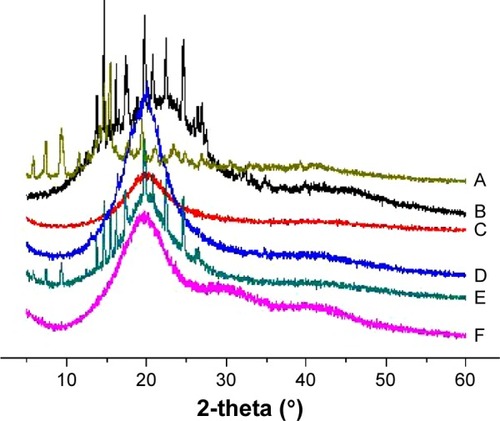
Figure 6 Differential scanning calorimetry analyses of (A) silymarin, (B) sodium glycocholate, (C) hydrogenated soybean phosphatidylcholine, (D) soybean phosphatidylcholine, (E) physical mixture of SM, SGC, and phosphatidylcholines, and (F) SM liposomes.
Abbreviations: SM, silymarin; SGC, sodium glycocholate.
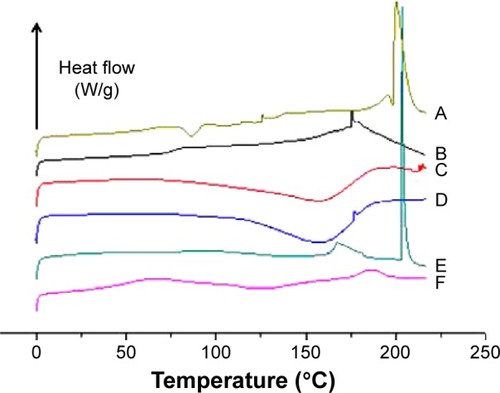
Figure 7 Sonication-induced leakage of silymarin (SM) from liposomes (lip) prepared by the solution-enhanced dispersion supercritical fluids (SEDS), thin-film dispersion (TFD), and reversed-phase evaporation (RPE) methods (n=3).
Abbreviation: s, seconds.
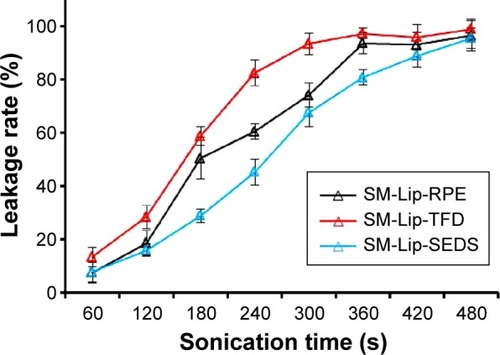
Figure 8 In vitro release of silymarin (SM) in sodium phosphate buffer solution (pH =6.8).
Note: The cumulative release of SM is shown from SM powder, SM liposomes prepared by the thin-film dispersion (TFD) method, SM liposomes prepared by the reversed-phase evaporation method (RPE), and SM liposomes prepared by the solution-enhanced dispersion by supercritical fluids (SEDS) method (n=3).
Abbreviation: h, hour.
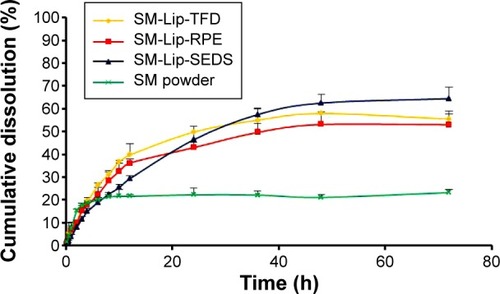
Table 3 The main pharmacokinetic parameters of the indicated preparations in male Wistar rats (n=6)
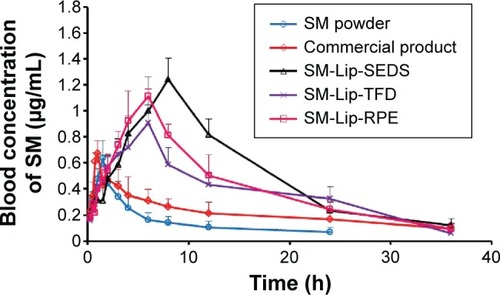
Figure 9 In vivo plasma concentration–time profiles.
Note: Levels of silymarin (SM) following oral administration of an aqueous SM suspension, commercial SM product, and SM liposomes (lip) prepared by different methods (n=6).
Abbreviations: h, hour; SEDS, solution-enhanced dispersion by supercritical fluids; TFD, thin-film dispersion; RPE, reversed-phase evaporation.