Figures & data
Figure 1 Characterization of the nanoshells used in this work.
Notes: (A) Scanning electron micrograph of the nanoshells. (B) Extinction spectrum of the nanoshells.
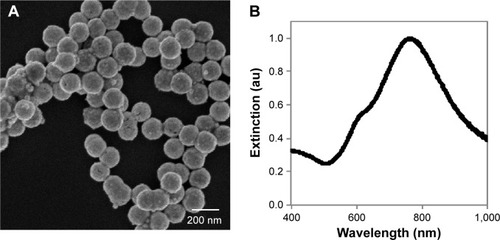
Figure 2 Evaluation of the impact of photothermal therapy on SUM149 cells.
Notes: Top: Silver staining reveals nanoshells bound to cells; (A) cells without nanoshells, (B) cells with nanoshells. Scale bar =150 μm. Bottom: Only cells exposed to both nanoshells and light displayed increased membrane permeability, evidenced by red EthD-1 fluorescence. Green fluorescence indicates viable cells with an intact membrane; (C) cells without nanoshells + near-infrared (NIR) light, (D) cells with nanoshells + NIR light. Within (D), cells outside the light exposed region indicated by the white dotted line remain viable confirming nanoshells alone are safe. Scale bar =500 μm.
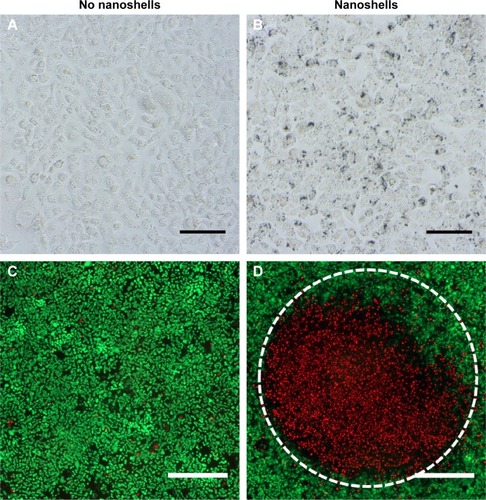
Figure 3 (A) Proposed mechanism of chemosensitization provided by nanoshell (NS)-mediated photothermal therapy. When cancer cells are incubated with NSs and doxorubicin and subsequently irradiated with near-infrared light, the heat produced by the NSs increases cell membrane permeability, resulting in increased doxorubicin accumulation in the cells. (B) Analysis of rhodamine 123 uptake by cells exposed to light, NSs, or both light and NSs. Relative fluorescence in each group is normalized to cells exposed to only media. The error bars represent standard deviation across six technical replicates. Differences in rhodamine fluorescence between groups were analyzed by ANOVA with post hoc Tukey. *P<0.02 for all comparisons to media only, light only, and NS only.
Abbreviations: NIR, near infrared; ANOVA, analysis of variance.
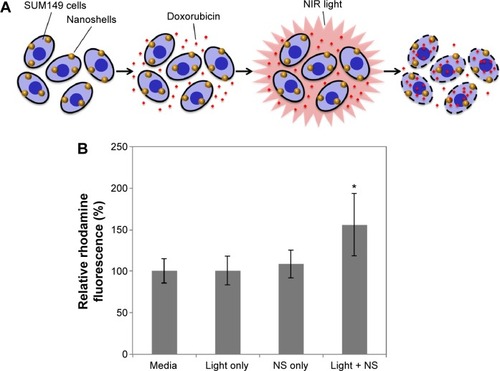
Figure 4 Analysis of dox accumulation and distribution in cells exposed to nanoshells with or without light exposure.
Notes: Within the images, red indicates dox and blue indicates nuclei. The first and second columns display the same field-of-view and the third column displays a different field-of-view. Yellow arrows indicate cytoplasmic regions of cells exposed to nanoshells without near-infrared (NIR) light, which display minimal dox fluorescence. White arrows indicate cytoplasmic regions of cells exposed to nanoshells with NIR light, which display amplified dox fluorescence. ImageJ analysis of fluorescence intensity in whole cells or specifically in nuclei is shown in the chart. Asterisks indicate P<0.0001 relative to cells not exposed to NIR light according to Student’s t-test. Scale bars =50 μm.
Abbreviations: DIC, differential interference contrast; dox, doxorubicin; DAPI, 4′,6-diamidino-2-phenylindole.
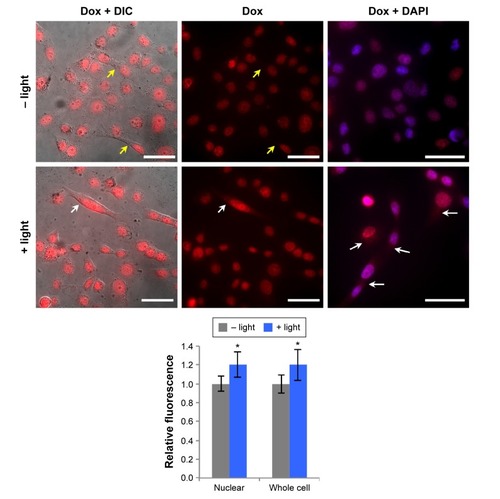
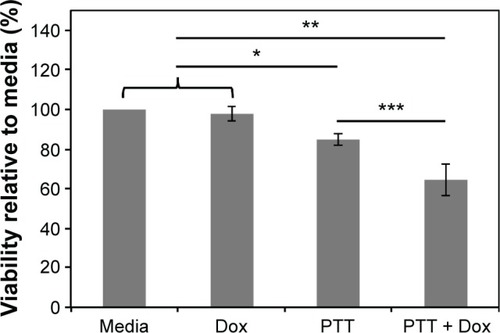
Figure 5 Viability of cells treated with doxorubicin (dox), photothermal therapy (PTT), or combination therapy normalized to the media control group.
Notes: The error bars represent the standard deviation across four biological replicates of the experiment. Groups with significant differences in viability according to ANOVA with post hoc Tukey are denoted with asterisks. *P<0.01, **P<0.0001, ***P=0.0003.
Abbreviation: ANOVA, analysis of variance.