Figures & data
Figure 1 Flowchart for Porphyra yezoensis polysaccharide extraction and purification.
Abbreviation: DEAE, diethylaminoethanol.
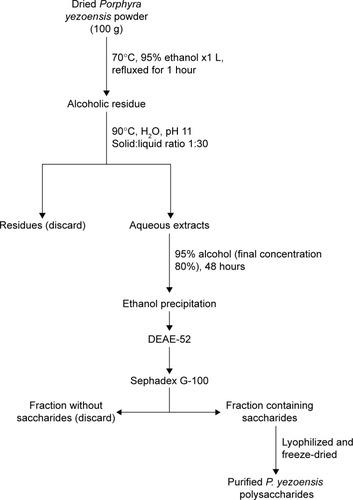
Figure 2 Flowchart for cationized Porphyra yezoensis polysaccharide preparation.
Abbreviations: PBS, phosphate-buffered saline; CDI, carbonyldiimidazole; PEI, polyethylenimine.
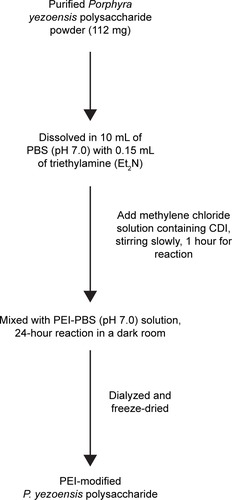
Figure 3 Fourier-transform infrared spectra of Porphyra yezoensis polysaccharide (PPS) and polyethylenimine (PEI)-PPS.
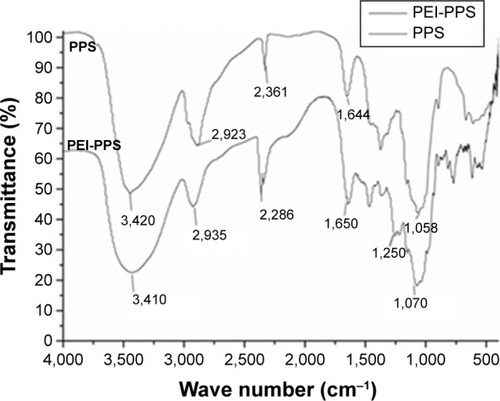
Figure 4 Electrophoretic mobility of plasmid in cationized Porphyra yezoensis polysaccharide (CPPS)–plasmid Wnt3a (pWnt3a) nanoparticles at various ratios.
Notes: Lane 1, Wnt3a naked plasmid; lanes 2–8, CPPS:pWnt3a weight ratios of 5:1, 10:1, 20:1, 40:1, 80:1, 100:1, and 150:1, respectively.
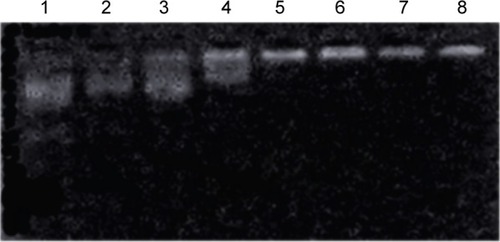
Figure 5 Cytotoxicity assay.
Notes: Bar 1, Lipofectamine 2000 (Lip2000)–plasmid Wnt3a (pWnt3a); bars 2–8, cationized Porphyra yezoensis polysaccharide (CPPS)-pWnt3a nanoparticles at ratios of 40:1, 80:1, 100:1, 150:1, 200:1, 250:1, and 300:1 from left to right, respectively; bar 9, free pWnt3a (control group); bars 10–14, multiple dilutions of PEI – 50-fold, 100-fold, 200-fold, 400-fold, and 800-fold from left to right, respectively. Data presented as average values (means) ± standard deviation of measurements from three replicates.
Abbreviation: PEI, polyethylenimine.
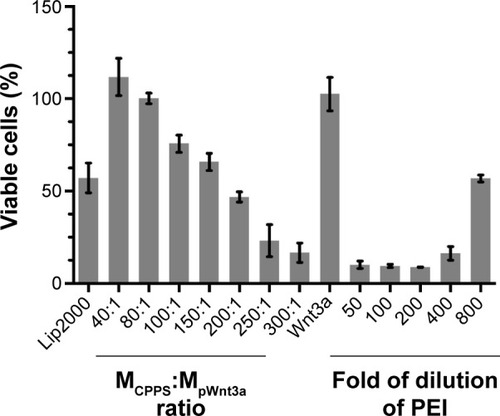
Figure 6 Zeta-potential results.
Notes: Bar 1, cationic Porphyra yezoensis polysaccharide (CPPS); bar 2, naked plasmid Wnt3a (pWnt3a); bars 3–5, CPPS-pWnt3a nanoparticles prepared at various CPPS:pWnt3a weight ratios – 40:1, 80:1, and 100:1 from left to right, respectively (means ± standard deviation of measurements from three replicates).
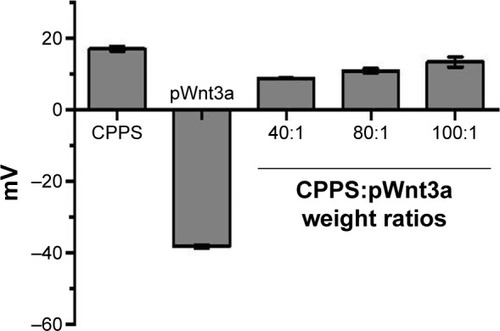
Figure 7 Characterization of cationized Porphyra yezoensis polysaccharide (CPPS)–plasmid Wnt3a (pWnt3a) nanoparticles.
Notes: (A) Transmission electron microscopy image of the nanoparticles at a CPPS:pWnt3a weight ratio of 40:1. (B) Size distribution of the nanoparticles at CPPS:pWnt3a weight ratios of 40:1, 80:1, and 100:1, respectively. (C) Particle-size distribution of the nanoparticles at a CPPS:pWnt3a weight ratio of 40:1.
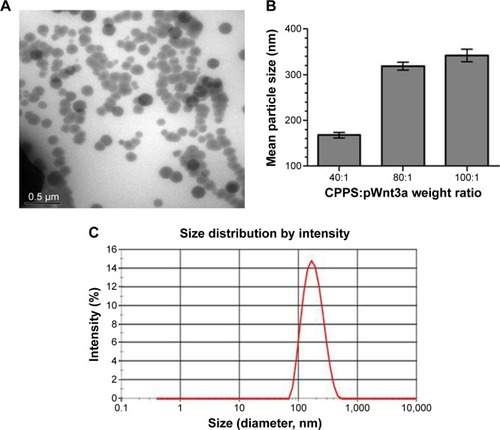
Figure 8 Observation of human umbilical cord mesenchymal stem cells transfected with plasmid GFP (pGFP).
Notes: (A) Free pGFP; (B) untreated cells (blank control); (C) Lipofectamine 2000–plasmid Wnt3a (pWnt3a); (D–F) cationized Porphyra yezoensis polysaccharide-pWnt3a nanoparticles prepared at 40:1, 80:1, and 100:1, respectively.
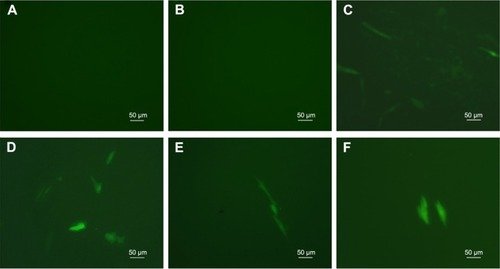
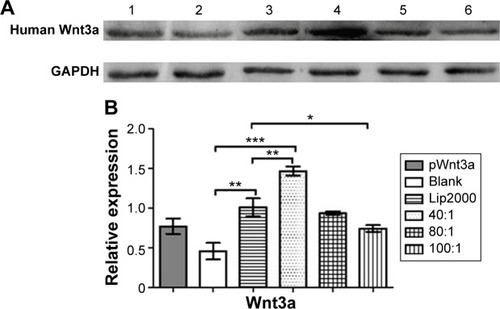
Figure 9 Protein-expression measurement.
Notes: (A) Western blotting indicated the expression of the Wnt3a protein, using GAPDH protein as the control. Lane 1, free plasmid Wnt3a (pWnt3a); lane 2, human umbilical cord mesenchymal stem cells (HUMSCs) without transfection; lane 3, Lipofectamine 2000 (Lip2000)-pWnt3a; lanes 4–6, HUMSCs transfected with cationized Porphyra yezoensis polysaccharide-pWnt3a nanoparticles prepared at 40:1, 80:1, and 100:1, respectively. (B) A quantitative analysis of the relative expression levels of Wnt3a (means ± standard deviation of measurements from three replicates). *P<0.05; **P<0.01; ***P<0.001; Student’s t-test.
Abbreviation: GAPDH, glyceraldehyde-3-phosphate dehydrogenase.