
Figures & data
Figure 1 Physicochemical characterization of GNR-Dox-Tf-NP.
Notes: (A) Changes in the surface charge observed during synthesis of gold nanorods. (B and C) TEM images of GNR-Dox-NP and GNR-Dox-Tf-NP (scale bar, 100 nm). (D) Absorbance spectra of bare GNR, GNR-Dox-NP, and GNR-Dox-Tf-NP in water. (E) Fluorescence emission spectra of free Dox and GNR-Dox-NP in PBS and Dox released from GNR-Dox-NP in acetate buffer (pH 5.5). (F) Dot blot assay showing transferrin conjugation to GNR-Dox-NP. Tf-SH was used as positive control and was compared to GNR-Dox-Tf-NP.
Abbreviations: GNR-mPEG, gold nanorod-methoxy polyethylene glycol; GNR-EMCH, gold nanorod-maleimidocapric acid hydrazine; GNR-Dox-NP, gold nanorod-doxorubicin-nanoparticle; GNR-Dox-Tf-NP, gold nanorod-doxorubicin-transferrin-nanoparticle; TEM, transmission electron microscopy; Tf-SH, Iminothiolated activated transferrin; au, arbitrary unit; GNR, gold nanorod; Dox, doxorubicin; rel, released; PBS, phosphate buffered saline.
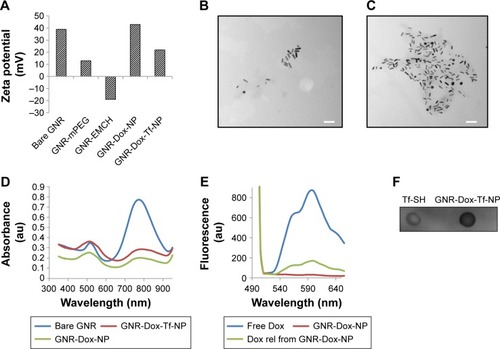
Figure 2 Dox release kinetics and optimization of Dox and Tf concentrations.
Notes: (A) In vitro release kinetics of Dox from GNR-Dox-NP and GNR-Dox-Tf-NP in PBS (pH 7.4) and acetate buffer (pH 5.5). (B) Optimization of Dox concentration and (C) Tf concentration in GNR-Dox-NP- and GNR-Dox-Tf-NP-treated A549 cell viability assay at 24 h. *P<0.05; **P<0.0001.
Abbreviations: GNR-Dox-NP, gold nanorod-doxorubicin-nanoparticle; GNR-Dox-Tf-NP, gold nanorod-doxorubicin-transferrin-nanoparticle; PBS, phosphate-buffered saline.
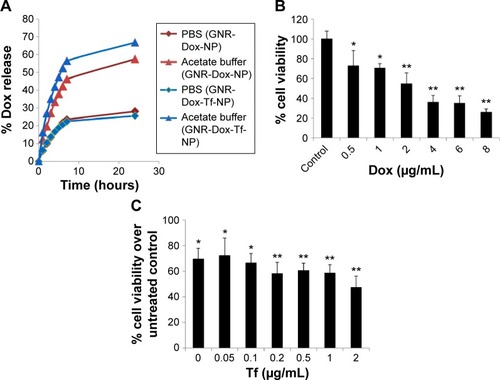
Figure 3 Cell uptake and cell viability studies.
Notes: (A) Hyperspectral fluorescence images of Dox in A549 cells after 2 h of incubation with (i) GNR-Dox-NP and (ii) GNR-Dox-Tf-NP. (B) Cell viability in A549, HCC827, and (C) HCASM cell lines treated with free Dox, GNR-Dox-NP, and GNR-Dox-Tf-NP at 24 h. Western blot images show TfR expression in (B) A549, HCC827, and (C) HCASM cells. β-actin was used as a loading control. *P<0.05; **P<0.0001.
Abbreviations: GNR-Dox-NP, gold nanorod-doxorubicin-nanoparticle; GNR-Dox-Tf-NP, gold nanorod-doxorubicin-transferrin-nanoparticle; HCASM, human coronary artery smooth muscle; NS, not significant.
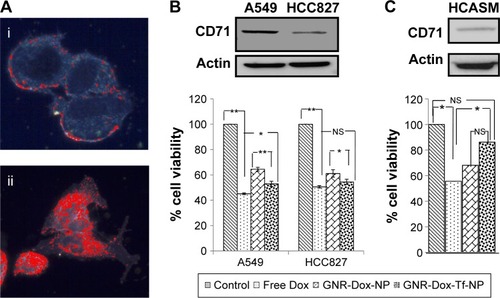
Figure 4 Cellular uptake mechanism: receptor-mediated endocytosis and blocking studies with HTf.
Notes: (A) GNR-Dox-Tf-NP particle uptake in A549 cells at 37°C and 4°C. GNR-Dox-Tf-NP-treated cells showed fluorescence (red) when incubated at 37°C indicating NP uptake that was abrogated when GNR-Dox-Tf-NP-treated cells were incubated at 4°C. Untreated cells incubated at 37°C served as control. Nuclei was stained blue with DAPI. (B) HTf (10 µM) abrogated the inhibitory activity of GNR-Dox-Tf-NP on A549 cells. *P<0.05; **P<0.0001.
Abbreviations: GNR-Dox-Tf-NP, gold nanorod-doxorubicin-transferrin-nanoparticle; HTf, human transferrin; DAPI, 4′6-diamidino-2-phenylindole.
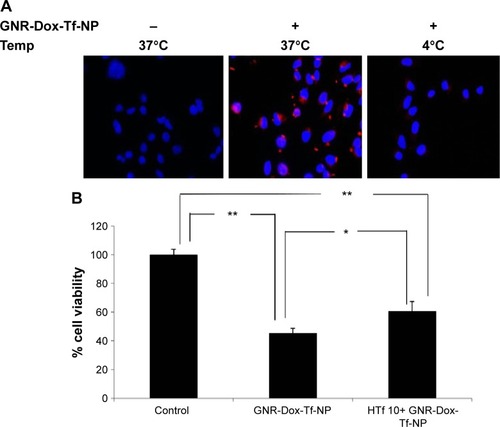
Figure 5 Receptor-mediated uptake enhancement studies with DFO.
Notes: (A) TfR (CD71) expression and (B) GNR-Dox-Tf-NP uptake increased in DFO-treated A549 cells (magnification 60×). (C) Increased fluorescence intensity was observed in GNR-Dox-Tf-NP-treated A549 cells compared with cells that were not treated with DFO. (D) GNR-Dox-Tf-NP-mediated cytotoxicity was significantly increased in the presence of DFO in A549 cells compared with other treatment groups. *P<0.05; **P<0.0001.
Abbreviations: GNR-Dox-Tf-NP, gold nanorod-doxorubicin-transferrin-nanoparticle; DFO, desferrioxamine; au, arbitrary unit.
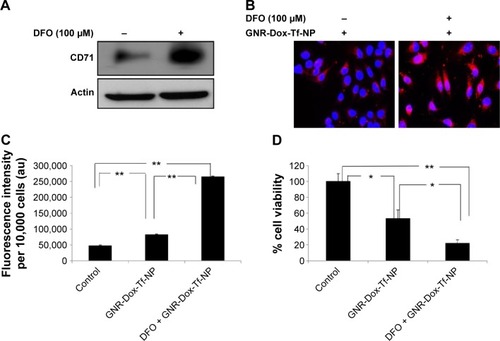
Figure 6 Apoptotic induction by GNR-Dox-Tf-NP in tumor versus normal cells.
Notes: Detection of caspase-9 in (A) A549 cells and (C) HCASM cells by Western blotting. Semiquantitative analysis shows activated caspase-9 expression levels in (B) A549 and (D) HCASM cells. *P<0.05; **P<0.0001.
Abbreviations: GNR-Dox-NP, gold nanorod-doxorubicin-nanoparticle; GNR-Dox-Tf-NP, gold nanorod-doxorubicin-transferrin-nanoparticle; casp-9, caspase-9; HCASM, human coronary artery smooth muscle.
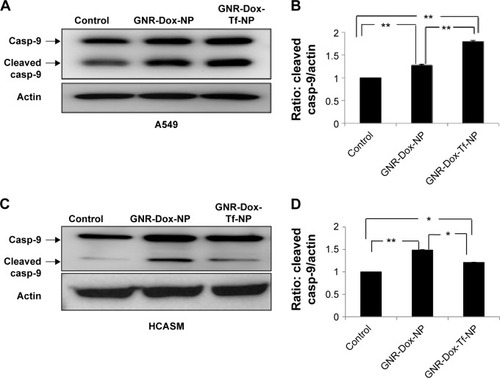
Figure 7 Treatment with GNR-Dox-Tf-NP induced tumor cell DNA damage.
Notes: (A) H2AX foci staining indicating DNA damage. (B) Histogram representing the number of H2AX foci per nucleus per treatment. (C) Comet assay showed that GNR-Dox-Tf-NP-treated cells had longer tails, indicative of greater DNA damage, than did GNR-Dox-NP-treated and untreated control cells. (D) Quantitative representation of the Olive tail moment showed that GNR-Dox-Tf-NP produced significant DNA damage compared with other treatment groups. *P<0.05; **P<0.0001.
Abbreviations: GNR-Dox-NP, gold nanorod-doxorubicin-nanoparticle; GNR-Dox-Tf-NP, gold nanorod-doxorubicin-transferrin-nanoparticle.
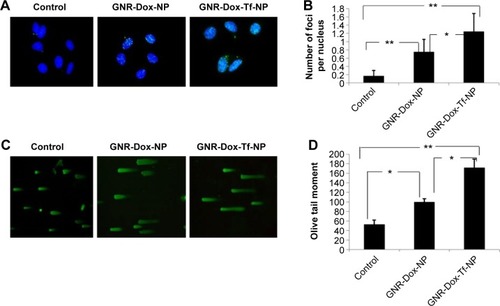
Figure 8 Schematic representation showing binding and entry of GNR-Dox-Tf-NP in TfR-expressing lung cancer cells.
Notes: (A) GNR-Dox-Tf-NPs bind to TfR that is overexpressed in lung cancer cells and enter the cells by endocytosis. GNR-Dox-Tf-NP subsequently enters the endosome compartment where the hydrazone linkage is cleaved to release Dox into the cytoplasm to produce cytotoxicity. (B) In the presence of free HTf, the entry of GNR-Dox-Tf-NP into the cells is diminished, resulting in reduced cytotoxicity when compared to cytotoxicity exerted by GNR-Dox-Tf-NP in the absence of HTf. (C) GNR-Dox-Tf-NP uptake is enhanced in the presence of DFO, resulting in enhanced cytotoxicity when compared to cytotoxicity exerted by GNR-Dox-Tf-NP in the absence of DFO.
Abbreviations: GNR-Dox-Tf-NP, gold nanorod-doxorubicin-transferrin-nanoparticle; HTf, human transferrin; DFO, desferrioxamine; TfR, transferrin receptor.
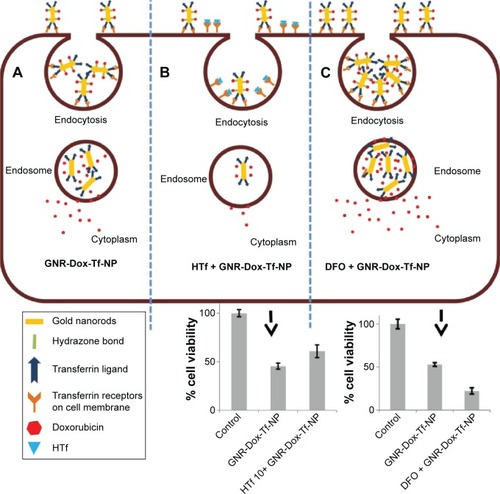
Figure S1 Schematic showing step-by-step synthesis of GNR-Dox-Tf-NP.
Abbreviations: Dox, Doxorubicin; PEG, polyethylene glycol; Tf-SH, transferrin + iminothiolane; GNR-Dox-Tf-NP, gold nanorod-doxorubicin-transferrin nanoparticle.
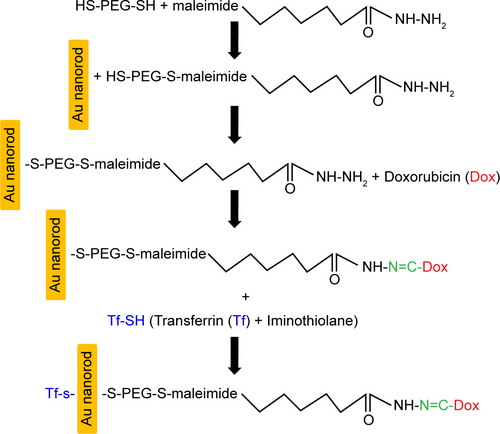
Figure S2 Histogram showing nanoparticle number and size distribution.
