Figures & data
Figure 1 Chemical structure of celastrol.
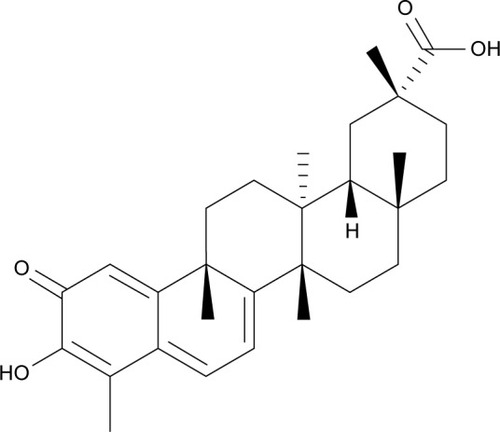
Figure 2 Photograph of CL-loaded NPs (left), and CL raw material (right) after dispersion in water.
Abbreviations: CL, celastrol; NPs, nanoparticles.
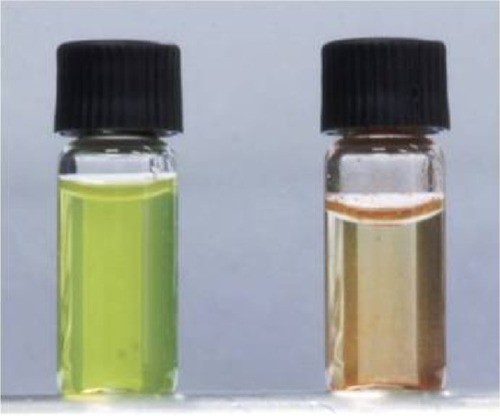
Table 1 Particle size (PS), polydispersity index (PDI), zeta potential (ZP), entrapment efficiencies (EE), drug loading content (DLC), and yields of production (YPs) of formulated NPs
Figure 3 Particle size distributions and SEM images.
Note: (A) empty and (B) CL-loaded NPs.
Abbreviations: CL, celastrol; NPs, nanoparticles; SEM, scanning electron microscopy.
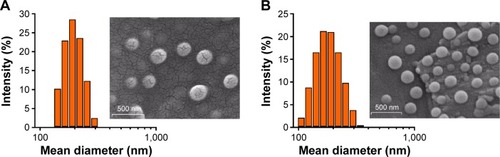
Figure 4 FTIR spectra of CL raw material, unloaded NPs, and CL-loaded NPs.
Abbreviations: FTIR, Fourier transform infrared spectroscopy; CL, celastrol; NPs, nanoparticles.
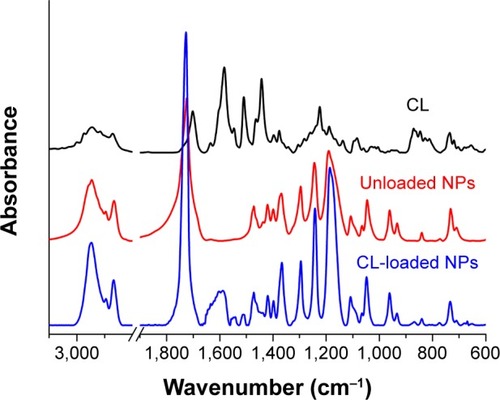
Figure 5 Raman spectra of CL raw material, unloaded NPs, and CL-loaded NPs.
Abbreviations: CL, celastrol; NPs, nanoparticles.
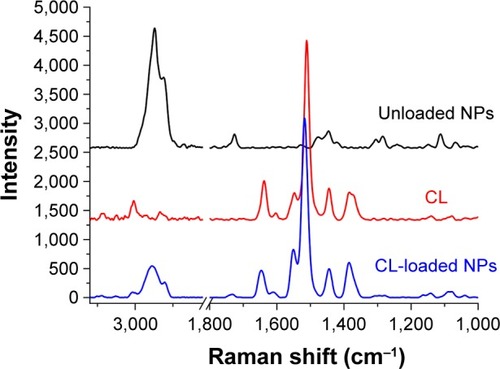
Figure 6 DSC curves of CL raw material, unloaded NPs, and CL-loaded NPs.
Abbreviations: DSC, differential scanning calorimeter; CL, celastrol; NPs, nano-particles; Exo, exothermic.
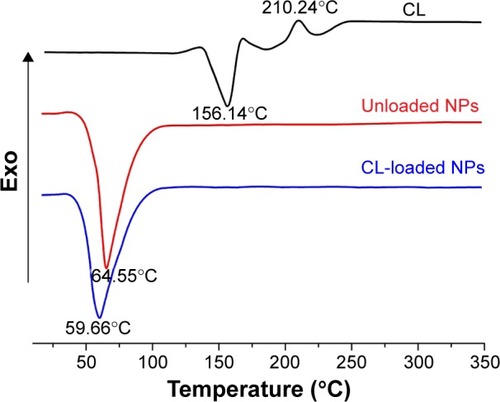
Figure 7 In vitro release profiles of free CL and CL-NPs in PBS (pH 7.4), performed for 72 hours.
Abbreviations: CL, celastrol; NPs, nanoparticles; PBS, phosphate-buffered saline.
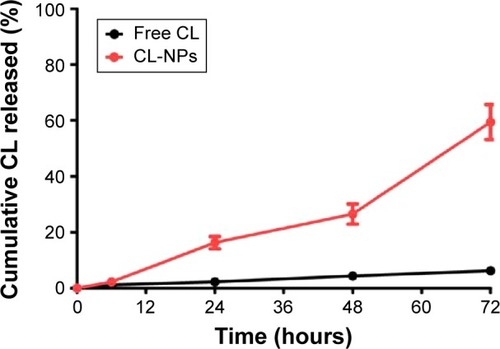
Figure 8 Viability of LNCaP (A), DU-145 (B), and PC3 (C) cells cultured with empty NPs (CL-NPs 0), and CL-loaded NPs (CL-NPs) for 24 hours, in comparison with that of free CL at the 0.5, 1.0, and 2.0 µM dose (n=3).
Notes: *Significantly different (P<0.05) from control. §Significantly different (P<0.05) from other free CL doses. °Significantly different (P<0.05) from other CL-NPs doses. #Significantly different (P<0.05) from free CL at equivalent doses.
Abbreviations: CL, celastrol; NPs, nanoparticles; Ctr, control.
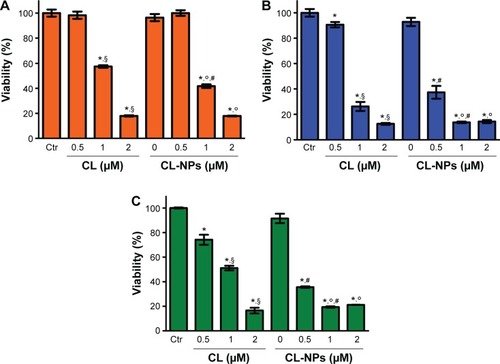
Figure 9 Confocal laser scanning microscopy images.
Notes: (A) LNCaP, (B) DU-145, and (C) PC3 cell lines, after 120 minutes incubation with FITC-loaded NPs at 37.0°c. The NPs’ internalization is observed as green fluorescence of FITC. Magnification 20×.
Abbreviations: NPs, nanoparticles; FITC, fluorescein isothiocyanate.
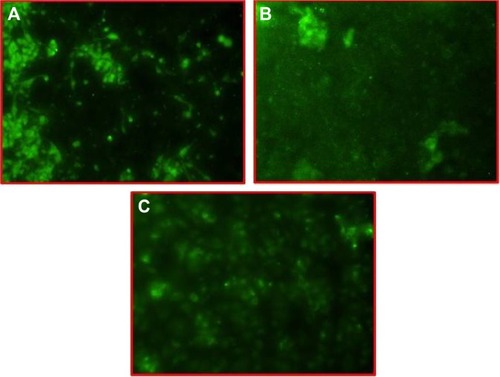
Figure 10 PC3 cell migration results.
Notes: (A) control, (B) CL-NPs, and (C) free CL, at CL concentration of 0.5 µM.
Abbreviations: CL, celastrol; NPs, nanoparticles.
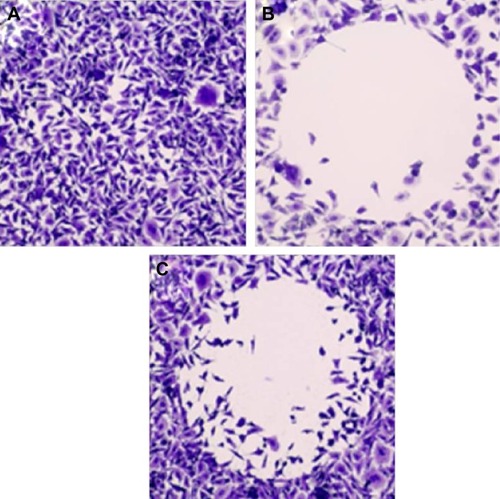
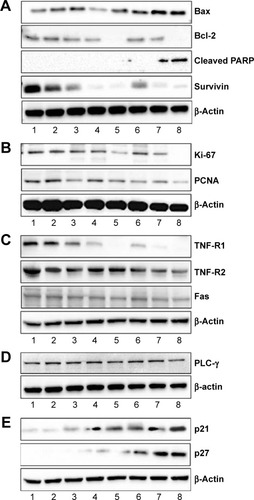
Figure 11 Comparative effects of pure CL and CL-NPs at various concentrations on apoptotic, proliferation, death receptor, angiogenesis, and cell cycle biomarkers.
Notes: (A) apoptotic, (B) proliferation, (C) death receptor, (D) angiogenesis, and (E) cell cycle biomarkers. The Pc3 cells were treated with each agent and harvested 24 hours after treatments. (lane 1: control; lane 2: unloaded NPs; lanes 3–5: pure CL at 0.5, 1.0, and 2.0 µM concentrations, respectively; Lanes 6–8: CL-NPs at 0.5, 1.0, and 2.0 µM concentrations, respectively.
Abbreviations: CL, celastrol; NPs, nanoparticles.