Figures & data
Table 1 Primers used for qRT-PCR
Figure 1 Scheme of the performed hyperthermia treatment.
Notes: The cells were seeded 24 hours before the addition of MTX–MNP, MTX, MNP, or “none” (0 hour). At 24 hours, the cells were treated for 1 hour with 44°C hot air. Cellular viability was assessed after a total incubation time of either 48 or 72 hours with MTX–MNP, MTX, MNP, or “none”.
Abbreviations: MNP, magnetic nanoparticle; MTX, methotrexate; h, hours.
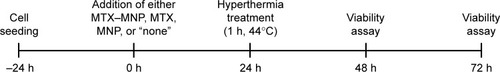
Table 2 Hydrodynamic diameter and ζ-potential of MNP is slightly increased after MTX coupling (MTX–MNP)
Table 3 Heterogenic and cell line-dependent ED50 values after MTX incubation
Figure 2 Time- and cell line-dependent cellular viability after MTX–MNP, MTX, or MNP exposure in the investigated cell lines.
Notes: Relative dehydrogenase activity was measured after an incubation time of 48 or 72 hours with either MTX–MNP, MTX, or MNP and correlated to the untreated 37°C control (n=6). (A) Cells were treated with 100 μg/mL MTX–MNP in cell culture medium. (B) Cells were treated with equivalent amounts of MTX (10 μg/mL) in cell culture medium as coupled to MTX–MNP. (C) Cells were treated with 100 μg/mL bare MNP in culture medium. t-test showed significant differences among different incubation times (*P<0.05, ***P<0.001).
Abbreviations: MNP, magnetic nanoparticle; MTX, methotrexate; h, hour; nd, not determined.
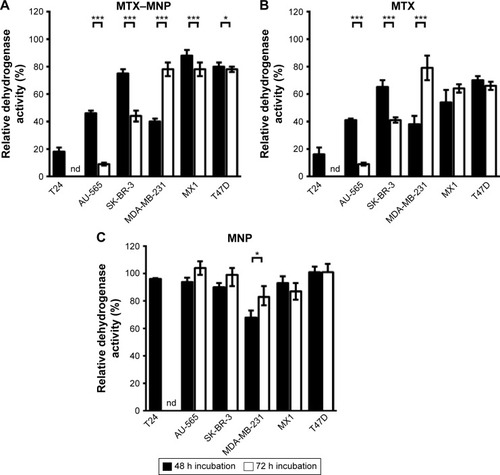
Figure 3 MTX- and cell line-dependent uptake of MNP.
Notes: Representative microscopy images of three exemplarily chosen cell lines (A: T24, B: AU-565, and C: SK-BR-3) representing different uptake kinetics. At 24 hours after seeding, the cells were incubated for 24, 48, or 72 hours with 100 μg/mLof either MNP or MTX–MNP and the intracellular iron was subsequently stained with Prussian blue. Bars indicate the percentage of cells with incorporated nanoparticles normalized to total the number of investigated cells. Blue, (MTX-)MNP; red, nuclei. Scale bar: 50 μm. Black stars indicate the significance of the general uptake of MTX–MNP in comparison to MNP for each point in time. Red stars indicate the significance of the proportion of cells with a high uptake for each point in time. n=3, ***P<0.001.
Abbreviations: MNP, magnetic nanoparticle; MTX, methotrexate; h, hour.
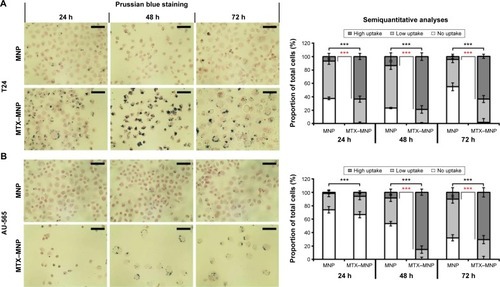
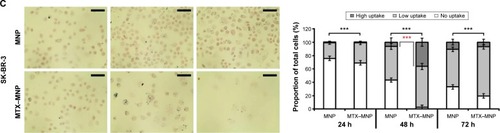
Figure 4 qRT-PCR and Western blot analyses revealed varying mRNA and protein levels of FRα, RFC, BCRP, MRP1, and MRP5 among different cell lines.
Notes: For relative mRNA level (n$3), target genes of cancer cell lines were normalized to the nontumor cell line HMEC-1. For protein analyses representative blots were chosen and beta actin served as loading control. To allow comparison with investigated cancer cell lines, proteins of nontumor HMEC-1 cells are shown.
Abbreviations: BCRP, breast cancer resistance protein; FR, folate receptor; MRP, multidrug resistance protein; qRT-PCR, quantitative real-time reverse transcription polymerase chain reaction; RFC, reduced folate carrier.
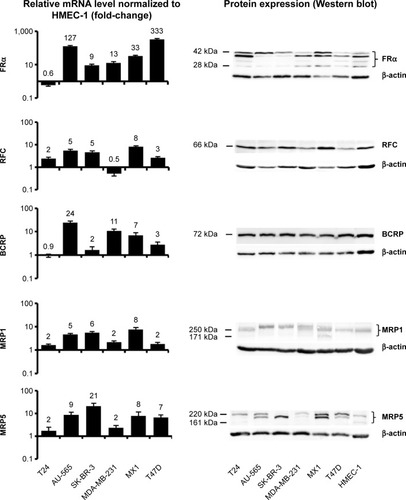
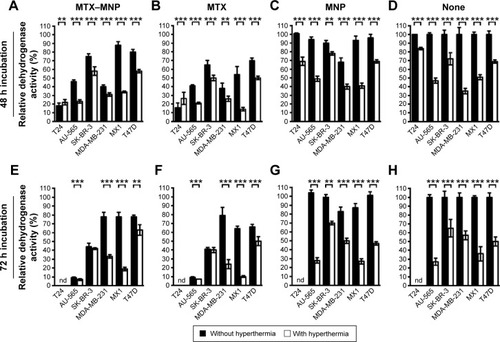
Figure 5 Cell line-dependent additive effect of MTX–MNP in combination with hyperthermia.
Notes: Hyperthermia treatment (1 hour, 44°C) was performed 48 hours after cell seeding. Relative dehydrogenase activity was measured after 48 hours (A–D) or 72 hours (E–H) with MTX–MNP, MTX, MNP, or “none” incubation and correlated to an untreated 37°C control. Cells were treated with either 100 μg/mL MTX–MNP (A, E), 10 μg/mL MTX (B, F), 100 μg/mL bare MNP (C, G), or without any additives (“none”; D, H) in the culture medium. Every treatment was performed in the absence (black bars) or presence (white bars) of hyperthermia. t-test showed significant differences between MTX–MNP, MTX, MNP, or none treatment with or without hyperthermia at **P<0.01, ***P<0.001.
Abbreviations: MNP, magnetic nanoparticle; MTX, methotrexate; h, hour; nd, not determined.