Figures & data
Figure 1 Cellular uptake and targeted localization in brain glioma cells after incubation with targeting epirubicin liposomes.
Notes: A and B indicate the results of cellular uptake by flow cytometry. The targeted localization of epirubicin liposomes (C) and targeting epirubicin liposomes (D) by confocal laser scanning fluorescent microscopy. C1 and D1 show the fluorescence signals of epirubicin from epirubicin and targeting epirubicin liposomes, respectively. The fluorescent intensity of C1 was obviously weaker than that of D1, indicating lower cellular uptake. C2 and D2 show the nuclei which were dyed by Hoechst. C3 and D3 show the bright light fields of brain glioma cells (without fluorescence). C4 and D4 show the overlapped images of C1–3 and D1–3, respectively.
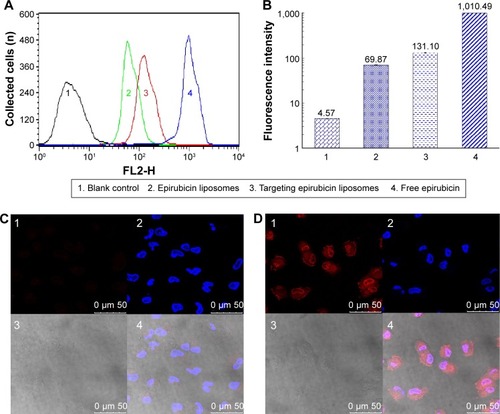
Figure 2 Cytotoxicity to brain glioma U87MG cells after treatment with targeting epirubicin plus celecoxib liposomes.
Notes: P<0.05. a, vs celecoxib liposomes; b, vs epirubicin liposomes; c, vs epirubicin plus celecoxib liposomes. Data presented as mean ± standard deviation (n=6).
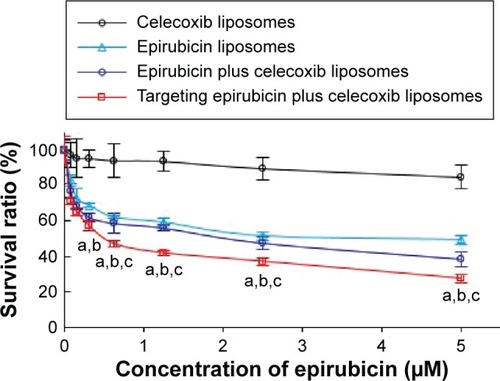
Figure 3 Transport ability of targeting epirubicin plus celecoxib liposomes across the BBB model.
Notes: (A) Schematic representation of the BBB model. (B) Transport ability, indicated by the death of brain glioma cells after drug transport across the BBB. P<0.05. a, vs 1; b, vs 2. Data presented as mean ± standard deviation (n=3).
Abbreviations: BBB, blood–brain barrier; BMVECs, brain microvascular endothelial cells.
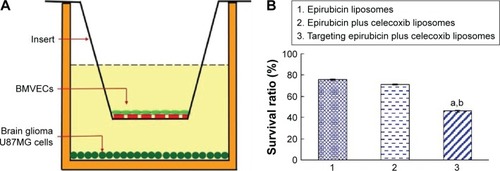
Figure 4 Induction of apoptosis of brain glioma cells and mechanism after treatment with targeting epirubicin plus celecoxib liposomes.
Notes: (A) Induction of apoptosis in brain glioma. a, vs 1; b, vs 2; c, vs 3. (B) Expression changes of enzymes or proteins involved in apoptotic signaling pathways. The intensity of green fluorescence captured by the high content screening system indicates that the expressions of caspase-8, caspase-3, and Bax were enhanced, while the expression of Mcl-1 was decreased, after drug treatments. Images were obtained under a microscope at 80× magnification.
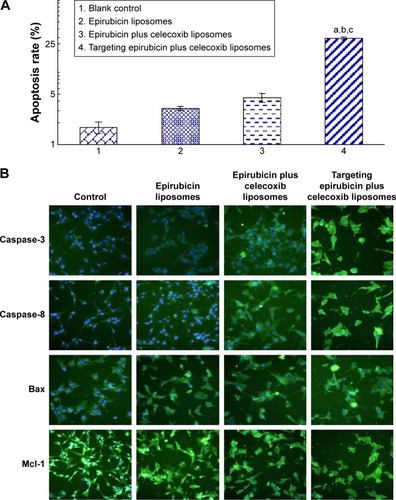
Figure 5 Penetration into brain glioma spheroids (indicated with arrow) after treatment with targeting coumarin liposomes.
Note: Results indicate that the targeting coumarin liposomes exhibit the strongest penetration into the brain glioma spheroids.
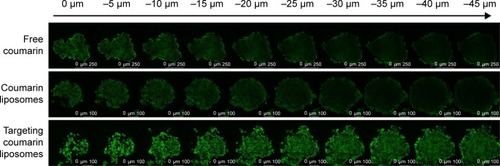
Figure 6 Destruction of VM channels in vitro formed by brain glioma U87MG cells in the 3-D Matrigel after treatment with targeting epirubicin plus celecoxib liposomes.
Notes: (A) Brain glioma cells without Matrigel. (B) Brain glioma VM channels formed in the 3-D Matrigel without treatment. (C–E). Destruction of VM channels after treatment with a fixed concentration of free celecoxib (1, 5, and 10 μM, respectively). (F) Destruction of VM channels after treatment with celecoxib liposomes (10 μM). (G) Destruction of VM channels after treatment with targeting celecoxib liposomes (10 μM). (H) Destruction of VM channels after treatment with targeting epirubicin plus celecoxib liposomes (5 μM epirubicin and 5 μM celecoxib). The scale bars in A–H indicate 400 μm.
Abbreviations: VM, vasculogenic mimicry; 3-D, three-dimensional.
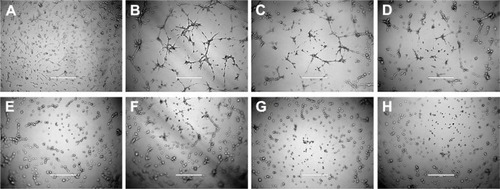
Figure 7 Inhibition of the VM indicators in brain glioma cells after treatment with targeting epirubicin and celecoxib liposomes.
Notes: (A) Activity ratios of MMP-2. (B) Activity ratios of MMP-9. (C) Activity ratios of FAK. (D) Activity ratios of PI3K. (E) Activity ratios of VE-Cad. (F) Activity ratios of VEGF. 1, Blank control; 2, celecoxib liposomes; 3, epirubicin liposomes; 4, epirubicin plus celecoxib liposomes; 5, targeting epirubicin plus celecoxib liposomes. P<0.05. a, vs 1; b, vs 2; c, vs 3; d, vs 4. Data presented as mean ± standard deviation (n=4).
Abbreviation: VM, vasculogenic mimicry.
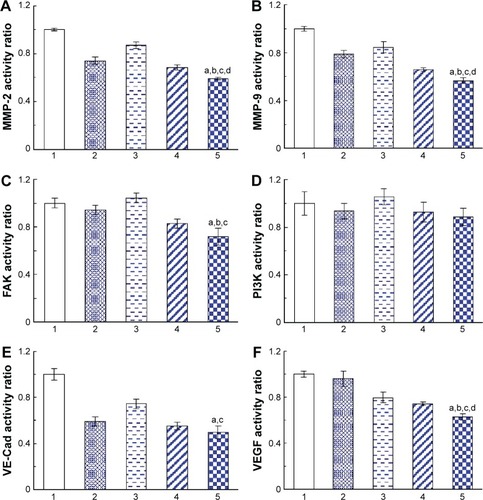
Figure 8 Imaging of distribution in the intracranial glioma-bearing nude mice after intravenous administration of targeting DiR liposomes.
Notes: (A) In vivo real-time imaging of distributions of different formulations within 48 hours. (B) Ex vivo imaging of distributions of different formulations in brain tissues and major organs after mice were killed at 48 hours.
Abbreviation: DiR, 1,1-dioctadecyl-3,3,3,3-tetramethylindotricarbocyanine iodide.
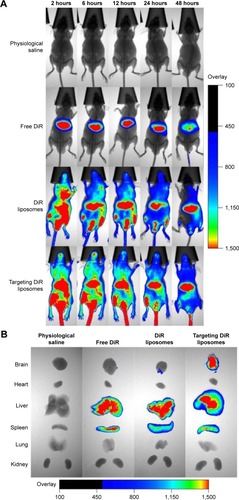
Table 1 Survival time and percentage-increased life span (ILS%) of glioma-bearing nude mice treated with targeting epirubicin plus celecoxib liposomes
Figure 9 Anticancer efficacy and destruction of VM channels in intracranial glioma-bearing nude mice.
Notes: (A) Kaplan–Meier survival curves. Arrows indicate the administration days. (B) Destruction of VM channels in the intracranial glioma-bearing nude mice using CD34-PAS dual staining. The scale bars indicate 200 μm. (B1) Normal brain tissue. (B2) Physiological saline. (B3) Free epirubicin. (B4) Epirubicin liposomes. (B5) Epirubicin plus celecoxib liposomes. (B6) Targeting epirubicin plus celecoxib liposomes. The yellow circles indicate the in vivo VM channels.
Abbreviation: VM, vasculogenic mimicry.
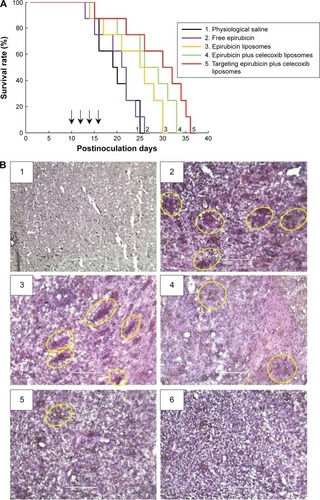
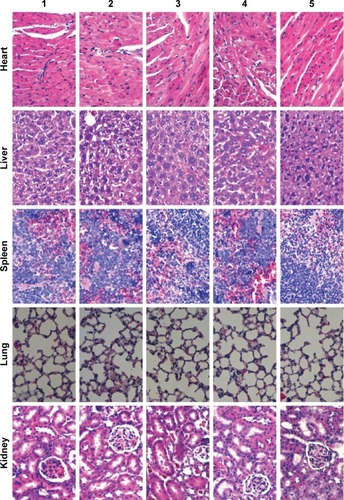
Figure 10 Preliminary toxicity evaluations in the major organs of the intracranial glioma-bearing nude mice after treatment with targeting epirubicin plus celecoxib liposomes.
Notes: 1, Physiological saline; 2, free epirubicin; 3, epirubicin liposomes; 4, epirubicin plus celecoxib liposomes; 5, targeting epirubicin plus celecoxib liposomes. Paraffin sections of major organ tissues were stained with hematoxylin and eosin. Images were obtained under a microscope at 40× magnification.