Figures & data
Figure 1 Inhibition of bacterial growth on Ti-nAg surface. A) The colony-forming units (CFU) of Pg and Aa on Ti-nAg and Ti-polished surface after 24-hour incubation. B) The bacterial ratio of Pg and Aa on Ti-nAg surface in relation to Ti-polished surface.
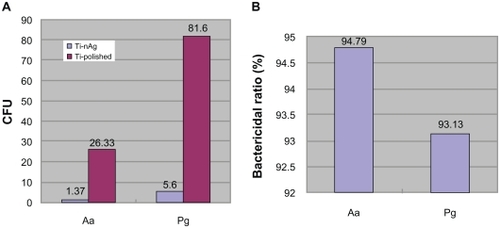
Figure 2 Scanning electron photomicrographs of the Ti-nAg (A) and Ti-polished (B) surfaces after incubation of Aa (magnification: 5000×; working distance: 8000 μm). The Aa bacteria exhibited a rod shape and reduced bacterial attachment to the Ti-nAg surface, relative to the Ti-polished surface.
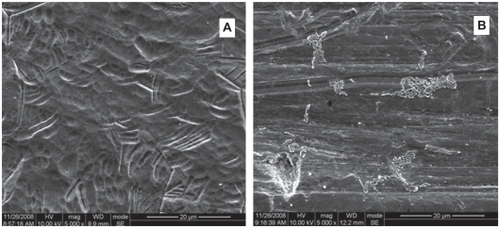
Figure 3 Scanning electron photomicrographs of the Ti-nAg (a) and Ti-polished (b) surfaces after incubation of Pg (magnification: 5000×; working distance: 8000 μm). The Pg bacteria exhibited a round shape and reduced bacterial attachment to the Ti-nAg surface, relative to the Ti-polished surface.
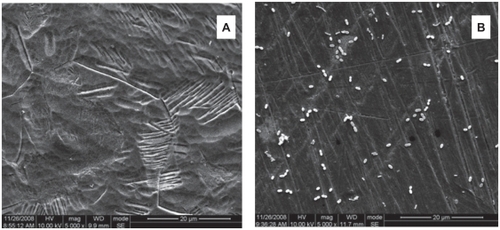
Figure 4 Cell viability estimated by the MTT assay after a 1-, 2-, 4-, 6- and 8-day incubation. Open bars represent the Ti-nAg group. The solid bars represent the Ti-polished group. No significant differences were observed between Ti-polished and Ti-nAg specimens.
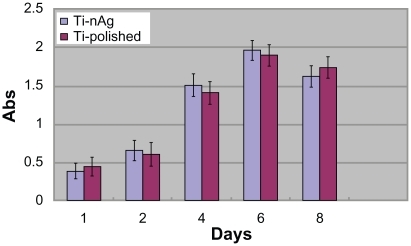
Figure 5 Fluorescence microscopy of adherent HGFs on plates with a Ti-nAg surface (A) or Ti-polished surface (B). HGFs exhibited a fusiform or polygonal spreading shape. No significant differences of cell morphology and cytoskeletal architecture were observed between Ti-polished and Ti-polished specimens.
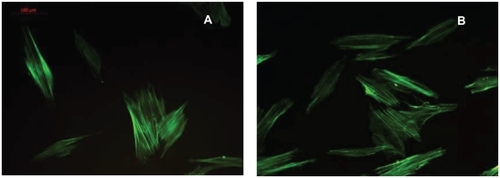
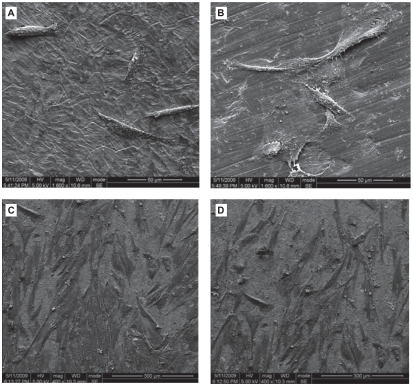
Figure 6 Scanning electron photomicrographs of human gingival fibroblasts (hGFs) cultured for 3 h (A, B) and 12 h (C, D) on plates with Ti-nAg (A, C) or Ti-polished (B, D) surfaces. The hGFs cultured on each surface underwent some proliferation, while maintaining normal spreading morphology. There was no obvious difference between the two surface groups.