Figures & data
Figure 1 Sequence and structure of RALA. Overview of composition of the composite nanoparticles.
Notes: (A) Primary sequence (top), secondary structure (middle), and surface representations of the RALA peptide, bottom left shows rotation to reveal the hydrophobic side, bottom right shows rotation to reveal the hydrophilic side. (B) Schematic representation of polymeric–cationic peptide composite nanoparticles.
Abbreviations: pDNA, plasmid DNA; PEG, polyethylene glycol; PLA, polylactic acid; RNPs, RALA nanoparticles.
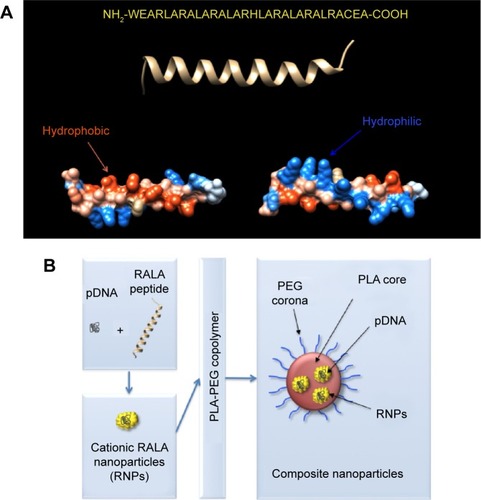
Figure 2 Formulation optimization of RNPs.
Notes: (A and B) Gel retardation assay. Numbers denote the N:P ratio. (C) Particle size analysis and zeta potential of RNPs made at different N:P ratios. Error bars show ±SD, n=3.
Abbreviations: L, 1 kb plus DNA ladder; N, native pDNA; OC, open circular/relaxed plasmid DNA; SC, supercoiled plasmid DNA; RNPs, RALA nanoparticles; pDNA, plasmid DNA; SD, standard deviation; PDI, polydispersity index.
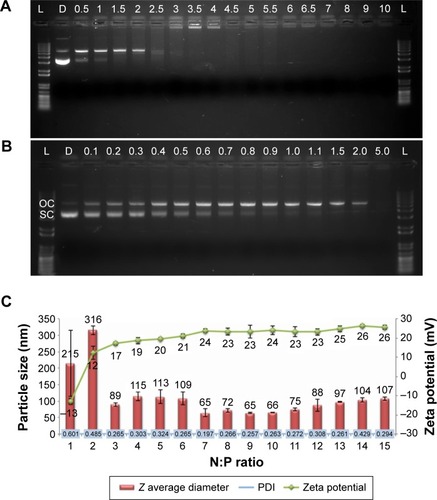
Table 1 Size and thermal properties of the synthesized PLA-PEG copolymers
Table 2 Physicochemical properties of the composite nanoparticles
Figure 3 Thermal transitions of the bulk copolymers and nanoparticles.
Note: MTDSC curves showing Tg regions of the composite nanoparticles prepared with copolymers as indicated (A) and Tg regions of the bulk copolymers (B).
Abbreviations: MTDSC, modulated temperature differential scanning calorimetry; PLA, polylactic acid; PEG, polyethylene glycol.
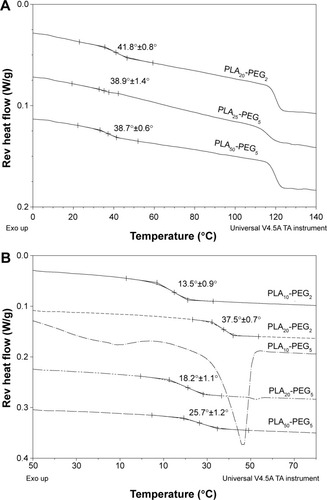
Figure 4 Gel retardation assay performed to evaluate the effect of dichloromethane and sonication on the stability of the RNPs.
Notes: (A) pDNA and RNPs were probe sonicated at 40%, 50%, and 60% amplitude for 30, 60, and 120 seconds; (B) DNA and RNPs vortexed with dichloromethane for 5, 15, 30, and 60 minutes. (C) RNPs processed through double emulsification process. The secondary emulsion was sampled after 1 and 2 minutes of sonication. Same samples were loaded with or without disruption with proteinase K after the sonication treatment.
Abbreviations: L, 1 kb plus DNA ladder; D, DNA only; pDNA, plasmid DNA; RNPs, cationic RALA nanoparticles.
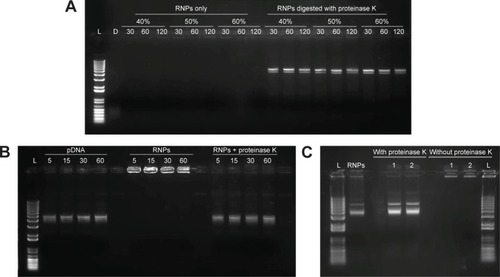
Figure 5 TEM images.
Notes: (A) RNPs; (B and C) PLA10-PEG2 composite nanoparticles; (D and E) PLA25-PEG5 composite nanoparticles; and (F and G) PLA50-PEG5 composite nanoparticles. Magnification of each image is shown in the bottom-right corner. The original value of nanoparticle size in panel A is 30.85 nm instead of 30.05 nm.
Abbreviations: TEM, transmission electron microscopy; RNPs, RALA nanoparticles; PLA, polylactic acid; PEG, polyethylene glycol.
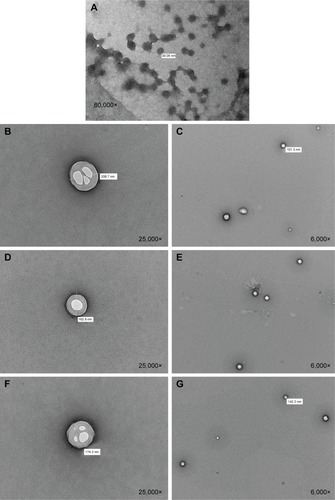
Figure 6 In vitro release study showing rate of DNA release from composite nanoparticles.
Notes: Each point is mean ± SD (n=4). SD is shown as either positive or negative error bars to aid better presentation of data.
Abbreviations: SD, standard deviation; PLA, polylactic acid; PEG, polyethylene glycol.
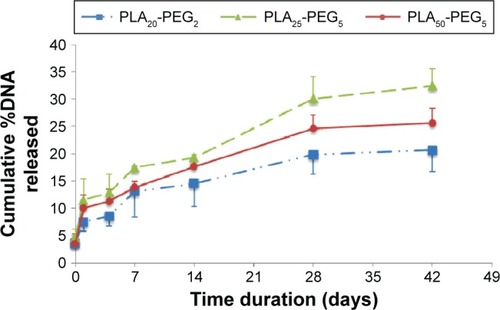
Figure 7 In vitro transfection of ZR-75-1 cell lines with PLA25-PEG5 composite nanoparticles and transferrin-modified PLA25-PEG5 composite nanoparticles (Tf-composites).
Notes: (A) Particle size and zeta potential characterization of RNPs, composite nanoparticles, and Tf-composite nanoparticles; (B) percent cell viability after treatment of the ZR-75-1 cells with nanoparticles; (C) transfection efficiency by flow cytometry and fluorescent microscopy: (i) DNA only; (ii) RNPs; (iii) composite nanoparticles; and (iv) Tf-composites. The top row depicts the bright field images, and the bottom row shows the same samples under fluorescence. Magnification was ×100. The numbers on the images indicate the percentage of cells expressing the GFP determined by flow cytometry.
Abbreviations: PLA, polylactic acid; PEG, polyethylene glycol; RNPs, RALA nanoparticles; GFP, green fluorescent protein; PDI, polydispersity index.
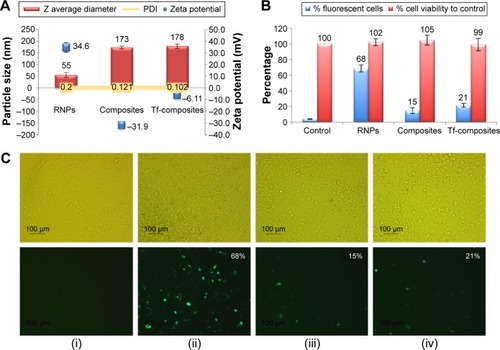
Figure S1 MTDSC analysis of the PLA-PEG copolymers synthesized for preparation of the composite nanoparticles for the determination of Tm.
Abbreviations: MTDSC, modulated temperature differential scanning calorimetry; PLA, polylactic acid; PEG, polyethylene glycol.
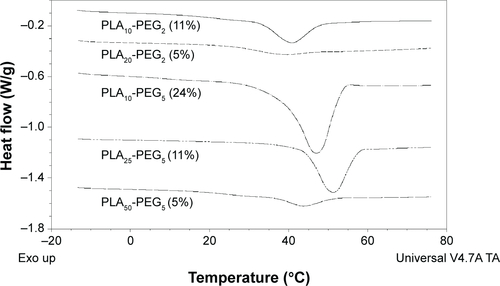
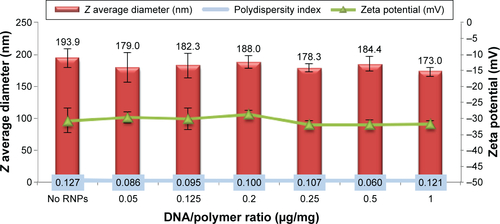
Figure S2 Effect of DNA/polymer ratio on the size and zeta potential of composite nanoparticles.
Note: Data are shown as mean ± SD (n=3).
Abbreviations: SD, standard deviation; RNPs, RALA nanoparticles.