Figures & data
Table 1 Nanoparticle size and zeta potential before and after the freeze-drying process
Figure 1 Scanning electron microscopy image of alginate-chitosan nanoparticles with an N/P ratio of 5 before (A) and after (B) the freeze-drying process, magnification 50×.
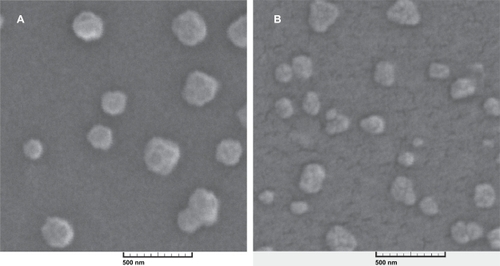
Figure 2 Release profile of nanoparticles with N/P ratio of 5 and 25 (A) over 50 hours and (B) in the first six hours.
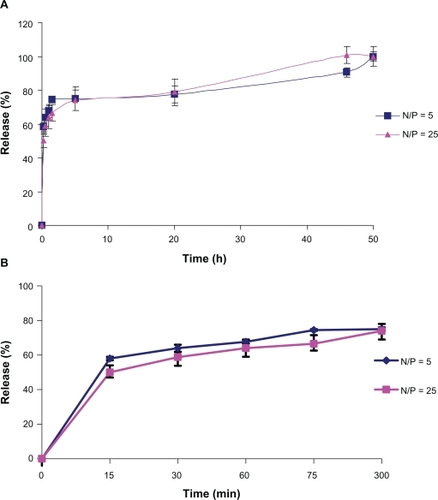
Figure 3 Gel electrophoresis analysis of alginate-chitosan nanoparticles. L (ladder), 1 (naked AS), 2 (N/P 5, one hour), 3 (N/P 5, three hours), 4 (N/P 5, three hours), 5 (N/P 25, one hour), 6 (N/P 25, three hours), 7 (N/P 25, six hours). The image has been taken after staining by ethidium bromide and visualized under ultraviolet light.
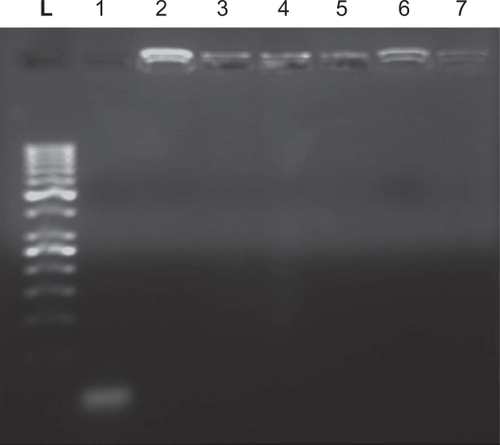
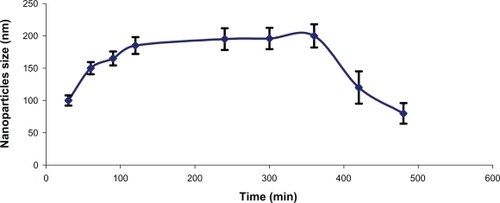
Figure 4 Swellability of antisense-loaded alginate-chitosan nanoparticles with an N/P ratio of 5, in phosphate-buffered saline at pH 7.4.