Figures & data
Table 1 Primers used for quantitative RT-PCR
Figure 1 The absorption spectrum of AgNPs synthesized by Bacillus mycoides culture supernatant.
Note: The absorption spectrum of AgNPs exhibited a strong broad peak at 426 nm, which is assigned to surface plasmon resonance of the particle.
Abbreviations: AgNPs, silver nanoparticles; au, arbitrary unit.
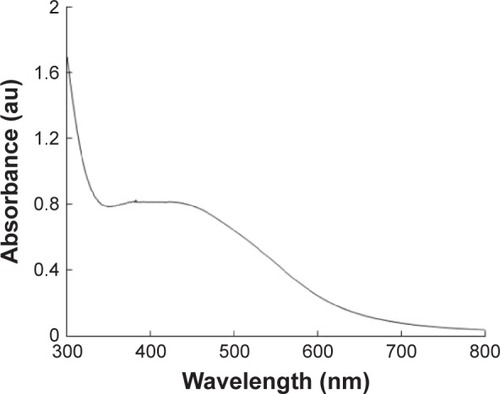
Figure 2 XRD spectra of AgNPs.
Note: There are three intense peaks across the spectrum of 2θ values ranging from 10° to 80°.
Abbreviations: XRD, X-ray diffraction; AgNPs, silver nanoparticles; au, arbitrary unit.
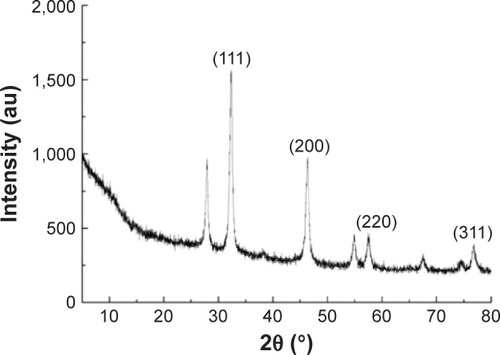
Figure 3 FT-IR spectra of AgNPs.
Abbreviations: FT-IR, Fourier transform infrared; AgNPs, silver nanoparticles.
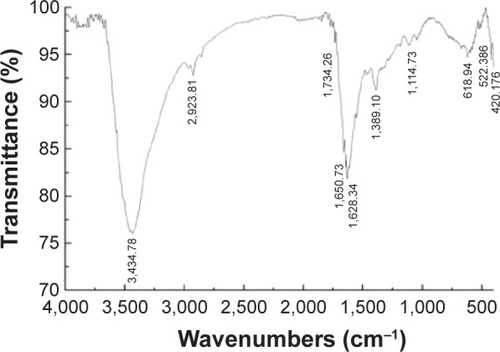
Figure 4 TEM images of AgNPs.
Notes: (A) TEM images of several fields were used to measure the AgNP particle size; micrograph (B) size distributions based on TEM images of AgNPs ranging from 4 to 24 nm.
Abbreviations: TEM, transmission electron microscopy; AgNPs, silver nanoparticles; au, arbitrary unit.
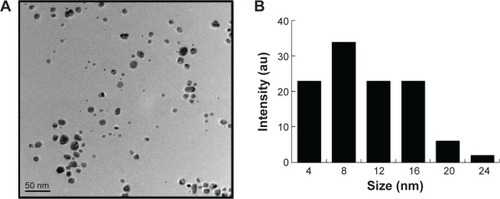
Figure 5 Effects of AgNPs on progress of meiosis prophase I.
Notes: (A) The characteristics of chromosomes in oocytes at meiosis I stained with SCP3 antibody (red) and Hoechst33342 (blue). (B) The percentage of fetal mouse oocytes at different phases of meiosis prophase I with or without exposure of pregnant mice to DEHP at 13.5 dpc. (C) The percentage of fetal mouse oocytes at different phases of meiosis prophase I with or without the exposure of pregnant mice to DEHP at 17.5 dpc. (D) The relative mRNA expression of meiosis-specific genes, including Stra8, Dazl, Scp1, Scp3, and Dmc1 at 13.5 dpc in the ovaries of fetal mice with or without maternal AgNPs exposure. Each sample for RNA extraction contains four ovaries, and the expression of these genes was normalized to β-actin. (E) The relative protein expression of Scp3 gene at 13.5 dpc in the ovaries of fetal mice with or without maternal AgNPs exposure. Every three ovaries were harvested at 13.5 dpc. All the experiments were repeated at least three times. The results are presented as means ± SD. *P<0.05; **P<0.01.
Abbreviations: AgNPs, silver nanoparticles; DEHP, diethylhexyl phthalate; dpc, days postcoitum; SD, standard deviation; mRNA, messenger RNA; SCP, synaptonemal complex protein.
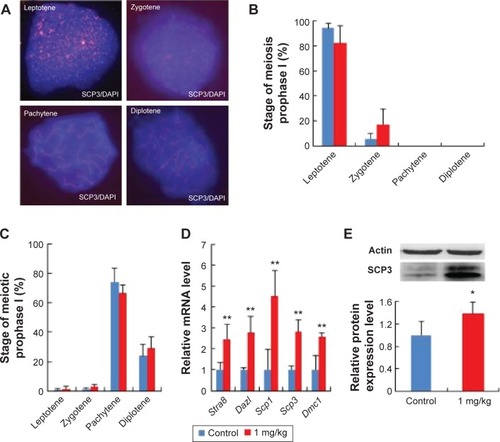
Figure 6 AgNP exposure altered total mRNA expression of the development-related genes of oocytes.
Notes: Relative mRNA levels of genes related to the development of oocytes at 15.5 dpc. n=15 in control group; n=14 in AgNPs-treated group. All of the experiments were repeated at least three times. The results are presented as means ± SD. *P<0.05; **P<0.01.
Abbreviations: AgNPs, silver nanoparticles; dpc, days postcoitum; mRNA, messenger RNA.
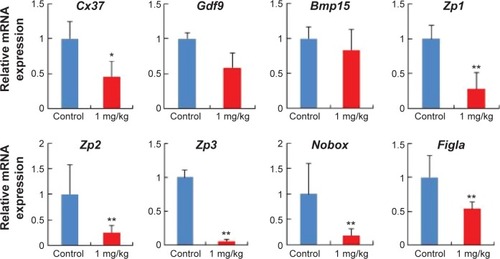
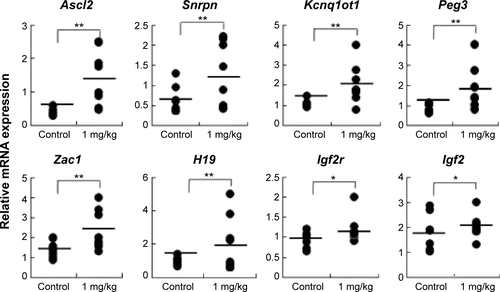
Figure 7 AgNP exposure altered total mRNA expression of imprinted genes relative to reference genes in embryos and placentas of female mouse at 15.5 dpc.
Notes: (A) Relative mRNA expression of H19 and Zac1 genes in embryos (n=15 in control group; n=14 in AgNPs-treated group). (B) Relative mRNA expression of imprinted genes (Ascl2, Snrpn, Kcnq1ot1, Peg3, Zac1, H19, Igf2r, and Igf2) in placentas (n=8 in control group; n=7 in AgNP-treated group). The results are presented as means ± SD. *P<0.05; **P<0.01.
Abbreviations: AgNPs, silver nanoparticles; SD, standard deviation; dpc, days postcoitum; mRNA, messenger RNA.
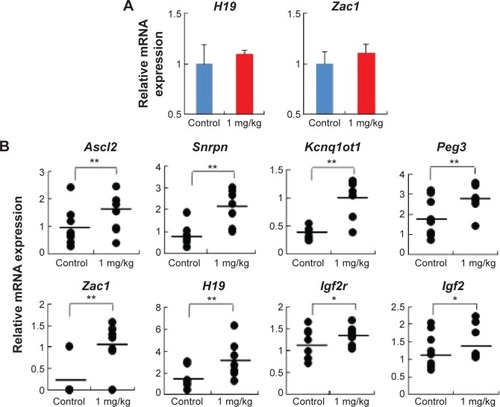
Figure 8 Analysis of control and AgNP-exposed placentas indicated that exposure significantly reduced methylation of Zac1 gene.
Notes: The Zac1 DMRs are depicted in (A), including the sequences analyzed in the (B) pyrosequencing and (C) bisulfite sequencing assays. (A) In total, 18 CpG sites (highlighted in red) located in a 383 bp region of the Zac1 DMR were assayed by bisulfite sequencing. The 18 CpGs were analyzed by pyrosequencing. (B) Pyrosequencing data in control and AgNPs exposure are shown with samples exhibiting black circles of Zac1. The y-axis represents the percentage of total methylation. The black horizontal line in each exposure group indicates the average methylation. The sample sizes analyzed in each exposure group are indicated; P<0.01 when analyzed using one-way ANOVA. The results are presented as means ± SD. **P<0.01. (C) Three placentas from both the control and AgNP exposure groups were analyzed by bisulfite sequencing, and the methylation status of Zac1 is shown. The CpG sites within DMRs are shown; filled squares denote methylated and open squares denote unmethylated. The percentages of methylation at all the CpGs are indicated. The average CpG methylation levels are 72.82% in the control group and 50.07% in the AgNPs-treated group (P<0.01).
Abbreviations: AgNPs, silver nanoparticles; DMR, DNA methylated region; ANOVA, analysis of variance.
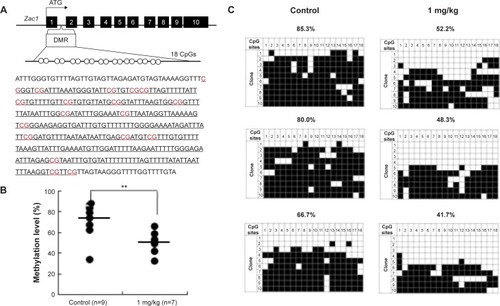
Figure 9 Analysis of control and AgNP-exposed placentas indicated that exposure increased methylation of the Igf2r gene.
Notes: The Igf2r DMRs are depicted in (A), including the sequences analyzed in the (B) pyrosequencing and (C) bisulfite sequencing assays. (A) In total, 30 CpG sites (highlighted in red) located in a 490 bp region of the Igf2r DMR were assayed by bisulfite sequencing. The 30 CpGs were analyzed by pyrosequencing. (B) Pyrosequencing data for the control and AgNPs exposure are presented with the samples exhibiting black circles of Igf2r. The y-axis represents the percentage of total methylation. The black horizontal line in each exposure group indicates the average methylation. The sample sizes analyzed in each exposure group are indicated. (C) Three placentas from both the control and AgNP exposure groups were analyzed by bisulfite sequencing, and the methylation status of Igf2r is indicated. The CpG sites within DMRs are shown; filled squares denote methylated and open squares denote unmethylated. The percentages of methylation at all CpGs are indicated. The average CpG methylation levels are 45.5% in the control group and 52.7% in the AgNPs-treated group (P<0.01).
Abbreviations: AgNPs, silver nanoparticles; DMR, DNA methylated region.
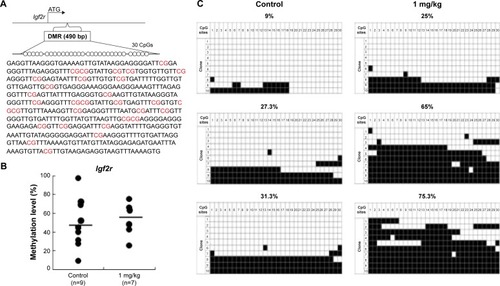
Figure S1 Samples from the control and AgNP-treated group placentas on the male mouse at 15.5 dpc were analyzed for total expression of the imprinted genes.
Notes: The relative mRNA expression of the imprinted genes (Ascl2, Snrpn, Kcnq1ot1, Peg3, Zac1, H19, Igf2r, and Igf2) in placentas (n=8 in control group; n=7 in AgNPs-treated group). The results are presented as means ± SD. *P<0.05; **P<0.01.
Abbreviations: AgNPs, silver nanoparticles; SD, standard deviation; dpc, days postcoitum; mRNA, messenger RNA.