Figures & data
Figure 1 Time-of-addition and effect of dendrimers on HIV binding experiments.
Notes: (A) Time-of-addition experiment. TZM.bl cells were infected with X4-HIVNL4.3, and tested compounds were added at different times pre and post infection. Viral infection, measured as luciferase activity, was determined. Antiretrovirals targeting different steps in viral cycle, such as T-20 (20 μM), AZT (10 μM), ATV (0.l μM), RAL (1 μM), and 5 μM nontoxic concentration of G3-S16 and G2-NF16 dendrimers, were used. Data represent the mean of three independent experiments. (B) Effect of anionic carbosilane dendrimers G3-S16 and G2-NF16 on HIV binding in PBMCs. Suramin was used as positive control. *P<0.05, **P<0.01, ***P<0.001 versus control. Data represent the mean ± SEM of three independent experiments.
Abbreviations: HIV, human immunodeficiency virus; PBMCs, peripheral blood mononuclear cells; SEM, standard error of the mean; NT, nontreated; h, hour; T-20, enfuvirtide; AZT, azidothymidine, zidovudine; ATV, atazanavir; RAL, raltegravir.
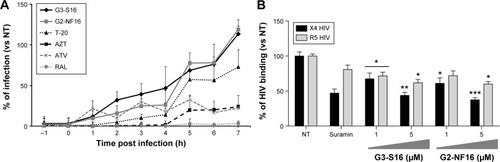
Figure 2 Inhibition of the gpl20–CD4 interaction.
Notes: (A) A cell-based fusion assay was used to mimic the gpl20–CD4-mediated fusion of the viral and host cell membranes. 8E5 and HeLa MAGI P4.R2 CD4+ cells were incubated with a range concentration of carbosilane dendrimers or control antiretrovirals. The percentage of 8E5-HeLa MAGI membrane cell fusion was calculated as β-gal activity. This experiment was performed in triplicate, and data points represent the mean ± SD of three independent experiments. (B) The level of gpl20–CD4 binding inhibition was assessed with a gpl20–CD4 ELISA in the presence or absence of polyanionic carbosilane dendrimers. The assay was done in triplicate; bars represent the mean ± SEM of two independent experiments.
Abbreviations: SD, standard deviation; ELISA, enzyme-linked immunosorbent assay; SEM, standard error of the mean; NT, nontreated.
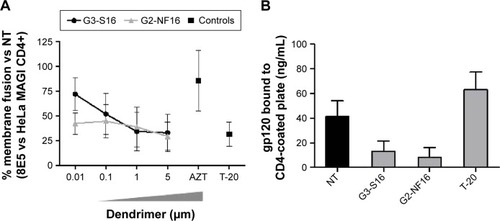
Table 1 MM-PBSA estimates of free energies of binding
Figure 3 HIV inactivation by G3-S16 and G2-NF16.
Notes: (A) HIV particles were treated with 5 μM of dendrimers or with Triton X-100 (1%) 1 hour before exposure to activated PBMCs. Antigen p24gag in PBMC supernatants was quantified by ELISA (**P<0.01, ***P<0.001 vs control). Data represent the mean ± SD of three independent experiments. (B) Molecular modeling of gpl20–dendrimer complexes. Top – dendrimers bound to gpl20 in the coreceptor binding site (i – gpl20–G2-NF16, ii – gpl20–G3-S16). Bottom – dendrimers bound to gpl20 near the V3 loop base (iii – gpl20–G2-NF16, iv – gpl20–G3-S16). V3-loop is in magenta; bridging sheet (terminal parts of V1/V2 loops) is in green. Only the closest amino acids to the dendrimer are shown (in ball and stick) using black color for carbons to distinguish them from dendrimer carbons (in gray, stick representation). Colors of the other elements are: O – red, S – yellow, H – white, and Si – tan. For the dendrimer SO3 groups, the sphere representation is used.
Abbreviations: HIV, human immunodeficiency virus; PBMCs, perpipheral blood mononuclear cells; ELISA, enzyme-linked immunosorbent assay; SD, standard deviation; NT, nontreated.
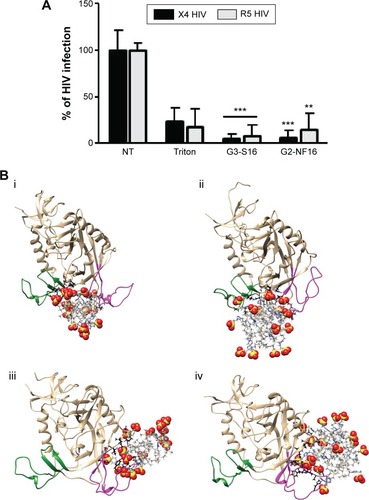
Figure 4 Interaction of G3-S16 and G2-NF16 with cellular surface markers.
Notes: Activated PBMCs were treated with dendrimers, and levels of CD4, CXCR4, and CCR5 at the cellular surface were followed by flow cytometry. Ratio of iMFI for each surface marker in comparison to nontreated cells is shown (iMFI = % of positive cells × MFI of surface marker). X4 ANTG = CXCR4 antagonist AMD3100; R5 ANTG = CCR5 antagonist TAK779. Both compounds were used as controls (*P<0.05, ***P<0.001 vs control). Data represent the mean ± SD of three independent experiments.
Abbreviations: PBMCs, perpipheral blood mononuclear cells; iMFI, integrated mean fluorescence intensity; SD, standard deviation; NT, nontreated.
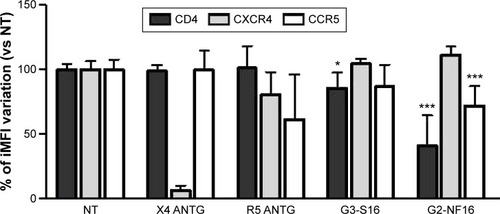
Figure 5 Dendrimer activity in cell-to-cell HIV transmission.
Notes: Reduction in viral transmission after pretreatment of target cells when cocultured with X4 or R5-HIV-1-infected donor Raji-DC-SIGN (A) or human primary mature DCs (B). Viral transfer was determined by measuring luciferase expression levels in TZM.bl receptor cells. Colchicine and suramin were used as controls. Data represent the mean ± SD of three independent experiments (**P<0.01 vs control).
Abbreviations: DC, dentritic cell; SD, standard deviation; NT, nontreated; HIV, human immunodeficiency virus.
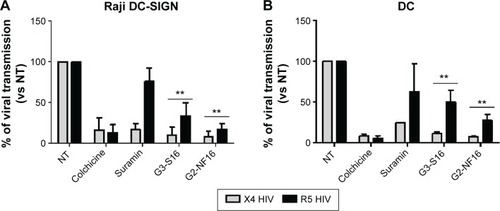
Figure 6 Effect of carbosilane dendrimers in infectious synapse.
Notes: Confocal microscopy images of DC–Jurkat cells contacts in absence (A) or presence of G3-S16 (B), G2-NF16 (C), or colchicine (D). Jurkat cells were stained in blue (CFSE-violet), HIV P24 was labeled in green, and CD81 marker was labeled in red. The number of total contacts between DCs and receptor Jurkat cells was counted, and % of infectious synapses was quantified. We defined an infectious synapse as a DC–Jurkat conjugate where the majority of HIV was focused at the zone of contact between both cells. Percentage of reduction in the number of infectious synapses with respect to NT cells is shown (E). Virological infectious synapses were counted when DC donor cells and receptor cells were treated with dendrimers. The distribution of HIV particles inside DCs during transinfection process was also analyzed and quantified (F). Fluorescence images showed different patterns of HIV distribution in DC–Jurkat conjugates: infectious synapse, intracellular compartment, or diffuse distribution of HIV particles inside cytoplasm or at the membrane. Events from two independent experiments were counted images were taken at 63× using a 63× PL-APO NA 1.3 glycerol immersion objective of an inverted confocal fluorescence microscope (SP2; Leica Microsystems, Heidelberg, Germany).
Abbreviations: DC, dentritic cell; HIV, human immunodeficiency virus; NT, nontreated; CFSE, carboxyfluorescein succinimidyl ester.
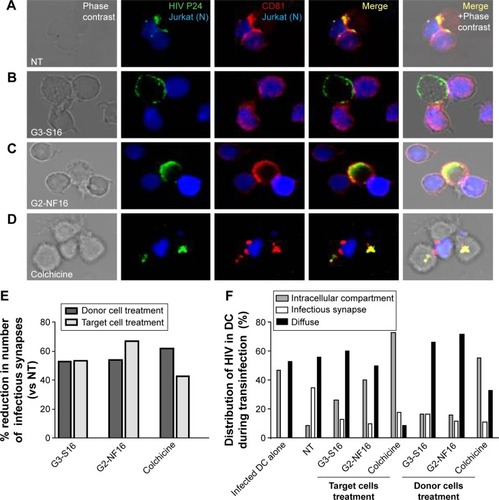
Figure S1 Structure of polyanionic carbosilane dendrimers.
Notes: (A) (i) Third-generation G3-S16, with 16 sulfated end groups. C256H508N48Na16O64S16Si29; MW: 6,978.41 g/mol. (ii) Computer model of G3-S16 equilibrated in salt water. (B) (iii) Second-generation G2-NF16, with 16 naphthylsulfonated end groups. C184H244N24Na16O56S16Si13; MW: 4,934.02 g/mol. (iv) Model of G2-NF16 dendrimer equilibrated in salt water. The dendrimer Si core atom is colored in magenta. The color coding for all remaining atoms is C – gray, O – red, Si – beige, and S – yellow.
Abbreviation: MW, molecular weight.
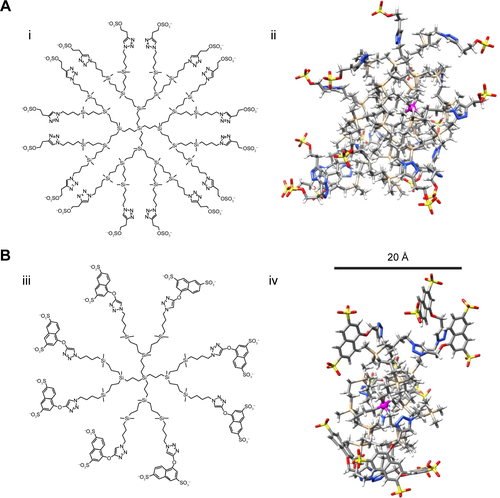
Figure S2 Specificity of antiviral activity.
Notes: Activated PBMCs were treated for 1 hour with nontoxic concentration of dendrimers and then infected overnight with env-X4-luc and env-VSVG-luc HIV-derived lentivirus. After 2 days of infection, viral infection was quantified measuring luciferase expression levels. AZT was used as positive control. (**P<0.01, ***P<0.001 vs control). Data represent the mean ± SD of three independent experiments.
Abbreviations: PBMCs, peripheral blood mononuclear cells; HIV, human immunodeficiency virus; SD, standard deviation; NT, nontreated; AZT, azidothymidine.
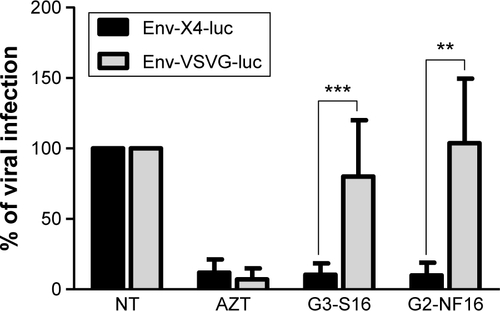
Figure S3 Equilibrated structure of gp120 after 100 ns of simulation (left) and superposition of this “unbound like” conformation with the original (bound) gp120 conformation (right).
Notes: Color coding: bridging sheet (terminal parts of V1/V2 loops) in green (“unbound like” configuration) and cyan (bound configuration) and V3 loop in magenta (“unbound like” configuration) and red (bound configuration).
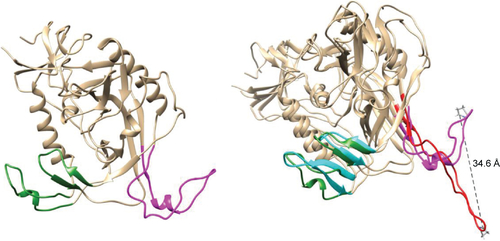
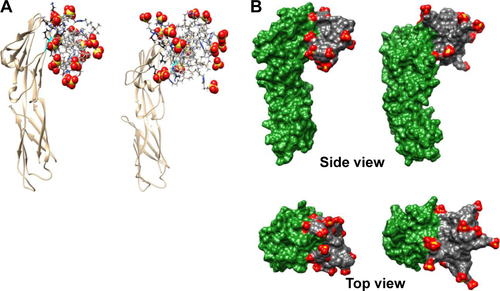
Figure S4 Molecular modeling of CD4–dendrimer complexes.
Notes: (A) CD4–G2-S16 (left) and CD4–G3-S16 (right). Just the closest (≤3 Å) amino acids to the dendrimer are shown (in ball and stick) using black color for carbons to distinguish them from dendrimer carbons (in gray, stick representation). Colors of the other elements are O – red, S – yellow, H – white, and Si – tan. Part of the small alpha helix on CD4 colored in cyan localizes two neighboring arginines that contribute to cationic character of the surrounding area. This small helix is one of the important parts of the CD4–gp120 or CD4–anionic dendrimer binding interface. For the terminal SO3 groups, the sphere representation is used. (B) CD4–G2-NF16 (left) and CD4–G3-S16 (right) complexes with visualized molecular surfaces to better see mutual dendrimer–protein integration. The CD4 molecular surface is in green and dendrimer molecular surface is in gray, except the terminal SO3 groups where red is used for oxygen and yellow for sulfur.