Figures & data
Figure 1 UV-vis spectrometry analysis of D-AgNPs and D-AuNPs formation.
Notes: Reaction mixture after incubation of Dendropanax leaf extract with silver nitrate (AgNO3) (A) and gold (III) chloride trihydrate (HAuCl4⋅3H2O) (B) at various periods of time (minutes). Time-dependent UV-vis spectra of the reaction mixture containing D-AgNPs (C) and D-AuNPs (D).
Abbreviations: UV-vis, ultraviolet-visible spectroscopy; OD, optical density; h, hours; min, minutes.
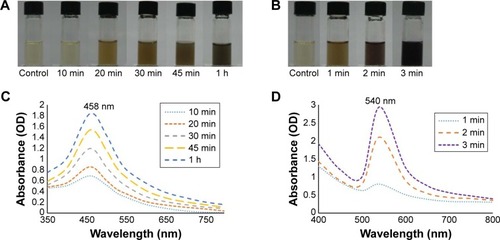
Figure 2 FE-TEM analysis of D-AgNPs and D-AuNPs.
Notes: TEM image of D-AgNPs in which the scale bar represents 200 nm (A), high-resolution image of a single nanocrystal at 50 nm (B) and 20 nm (C), SAED pattern (D). TEM image of D-AuNPs in which the scale bar corresponds to 20 nm (E), high-resolution image of a single nanocrystal at 5 nm (F) and 10 nm (G), and SAED pattern (H).
Abbreviations: TEM, transmission electron microscopy; SAED, selected area electron diffraction; D-AgNPs, Dendropanax silver nanoparticles; D-AuNPs, Dendropanax gold nanoparticles.
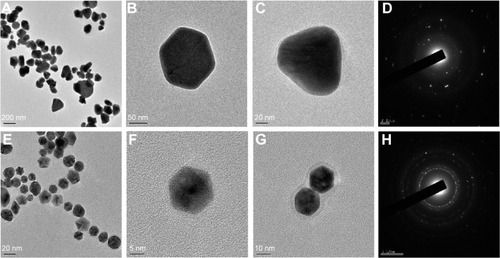
Figure 3 EDX and elemental mapping for the purity analysis of both D-AgNPs and D-AuNPs.
Notes: D-AgNPs observed in EDX spectrum (A), electron micrograph region (B), and distribution of silver in elemental mapping (C). D-AuNPs observed in EDX spectrum (D), electron micrograph region (E), and distribution of gold in elemental mapping (F).
Abbreviations: EDX, energy dispersive X-ray analysis; D-AgNPs, Dendropanax silver nanoparticles; D-AuNPs, Dendropanax gold nanoparticles.
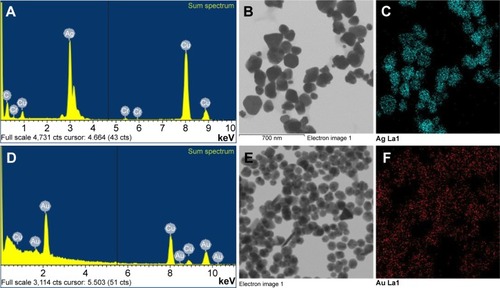
Figure 4 XRD patterns of D-AgNPs (A) and D-AuNPs (B) synthesized from D. morbifera leaf extract.
Abbreviations: XRD, X-ray diffraction; D-AgNPs, Dendropanax silver nanoparticles; D-AuNPs, Dendropanax gold nanoparticles; D. morbifera, Dendropanax morbifera.
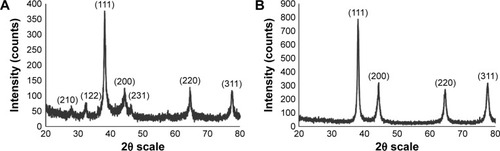
Figure 5 Particle size distribution of D. morbifera-mediated D-AgNPs according to intensity (A), number (B), and volume (C); and D-AuNPs according to intensity (D), number (E), and volume (F).
Abbreviations: D. morbifera, Dendropanax morbifera; D-AgNPs, Dendropanax silver nanoparticles; D-AuNPs, Dendropanax gold nanoparticles.
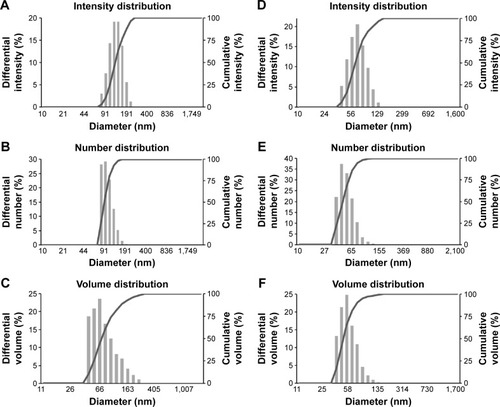
Figure 6 Effect of D-AgNPs (A) and D-AuNPs (B) on HaCaT cells.
Notes: Cells (1×10⁵ cells/well) were treated with the indicated concentrations of D-AuNPs and D-AgNPs for 48 hours. Cell viability was determined with a colorimetric assay using MTT solution. Error bars represent the standard deviation (n=3).
Abbreviations: D-AgNPs, Dendropanax silver nanoparticles; D-AuNPs, Dendropanax gold nanoparticles; MTT, 3-(4, 5-dimethylthiazol-2-yl)-2-5-diphenyletrazolium bromide.
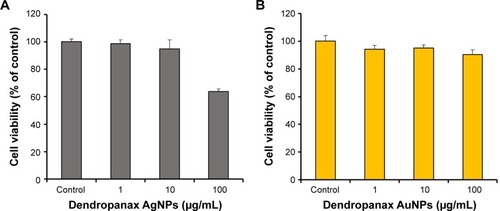
Figure 7 Dose-dependent cytotoxicity of (A) D-AgNPs and (B) D-AuNPs after 48 hours of treatment in A549 human lung cancer cells.
Notes: Error bars represent the standard deviation (n=3). ***P<0.001 versus control (untreated group). The statistical significance of differences between values was evaluated by one-way ANOVA.
Abbreviations: D-AgNPs, Dendropanax silver nanoparticles; D-AuNPs, Dendropanax gold nanoparticles.
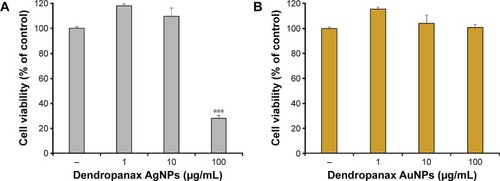
Figure 8 Synergistic effect of Compound K and D-NPs.
Notes: Cytotoxicity of CK on A549 human lung cancer cells after 48 hours of treatment (A). Synergistic effect of D-AgNPs (B) and D-AuNPs (C) combined with CK in a dose-dependent manner after 48 hours of treatment in A549 human lung cancer cells. Dose-dependent response. Error bars represent the standard deviation (n=3). ***P<0.001 versus control (untreated group). The statistical significance of differences between values was evaluated by one-way ANOVA. − indicates the absence of D-AgNPS or cmpound K and + indicates the presence of D-AgNPS or compound K in the culture medium.
Abbreviations: CK, compound K; D-AgNPs, Dendropanax silver nanoparticles; D-AuNPs, Dendropanax gold nanoparticles.
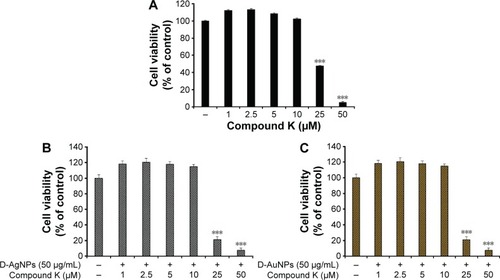
Figure 9 Schematic workflow of D. morbifera silver and gold nanoparticle synthesis and application.
Note: Cell apoptosis was determined by Hoechst 33258 staining.
Abbreviations: D. morbifera, Dendropanax morbifera; h, hour; CK, compound K; min, minutes; D-AgNPs, Dendropanax silver nanoparticles; D-AuNPs, Dendropanax gold nanoparticles.
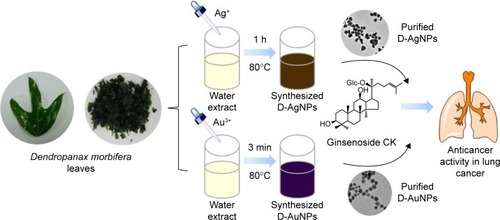
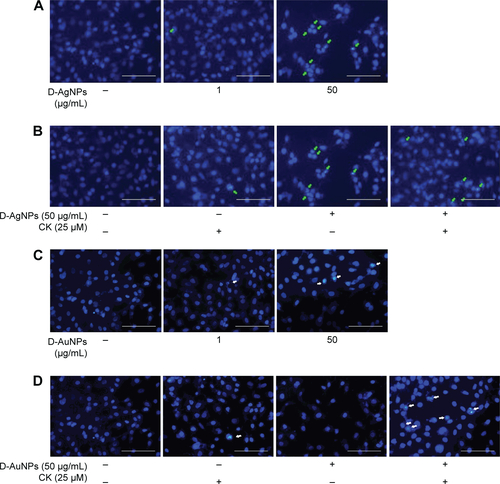
Figure S1 Cell apoptosis determined by Hoechst 33258 staining.
Notes: Morphological changes in A549 cells treated with (A) D-AgNPs, (B) CK combination with D-AgNPs, (C) D-AuNPs, and (D) CK combination with D-AuNPs for 48 hours and stained with Hoechst 33258 dye. A synergistic effect induced apoptosis and morphological changes in A549 cells. Apoptotic cells are indicated with an arrow. The magnification scale is 400×. Scale bars are 10 µm.
Abbreviations: CK, compound K; D-AgNPs, Dendropanax silver nanoparticles; D-AuNPs, Dendropanax gold nanoparticles.