Figures & data
Table 1 Reverse transcription polymerase chain reaction (RT-PCR) primers and conditions
Figure 1 Characteristics of DEX-loaded BGN and the composite nanofibers.
Notes: (A and B) TEM of BGN at different magnifications. (C) DEX adsorption amount onto BGN, recorded at varying BGN loading concentrations. (D) DEX release amount from the BGN, showing a rapid release pattern. (E) SEM of composite nanofiber. (F) TEM internal image of the nanofiber. (G) Degradation of the nanofiber measured via weight change up to 28 days. (H) DEX release from the composite nanofiber, showing a highly sustained release pattern.
Abbreviations: DEX, dexamethasone; BGN, bioactive glass nanoparticle; TEM, transmission electron microscopy; SEM, scanning electron microscopy; h, hours; wt, weight.
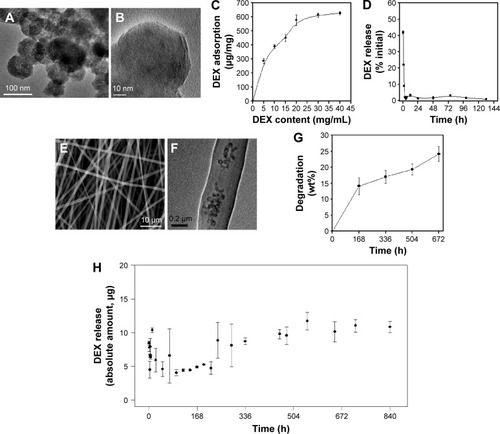
Figure 2 Cell viability measured by MTT assay.
Notes: DEX-free (−) and DEX-containing (+) media were used as negative and positive control, respectively. Data are the representatives of three independent experiments. *P<0.05 vs (−) control.
Abbreviations: DEX, dexamethasone; BGN, bioactive glass nanoparticle.
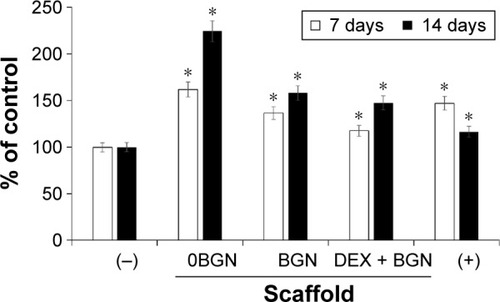
Figure 3 mRNA expression of genes.
Notes: (A) Odontogenic marker genes (ALP, DMP-1, DSPP). (B) Transcriptional factors involved in odontogenesis (Runx2 and Osterix).
Abbreviations: ALP, alkaline phosphatase; DMP-1, dentin matrix protein-1; DSPP, dentin sialophosphoprotein; DEX, dexamethasone; BGN, bioactive glass nanoparticle; GAPDH, glyceraldehyde 3-phosphate dehydrogenase.
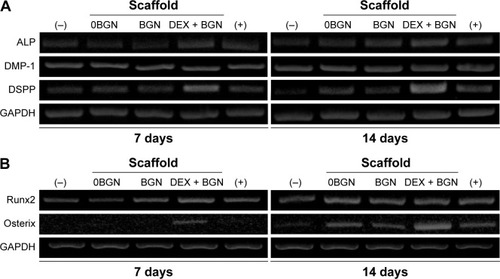
Figure 4 ALP activity and ARS staining.
Notes: (A) ALP activity, and (B) ARS staining image, showing the odontogenic differentiation of HDPCs. Data are the representatives of three independent experiments. *P<0.05 vs (−) control; #P<0.05 in comparison between BGN and DEX-BGN.
Abbreviations: ALP, alkaline phosphatase; ARS, Alizarin Red S; HDPC, human dental pulp cell; BGN, bioactive glass nanoparticle; DEX, dexamethasone.
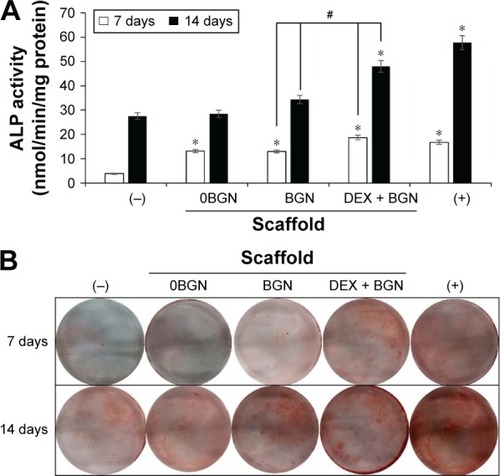
Figure 5 Integrin signaling pathway analyses.
Notes: (A) mRNA expressions of integrin subsets (α1, α5, β1, and β3), by RT-PCR. GAPDH was used as the housekeeping gene. (B) Protein expressions of intracellular adhesive molecules (p-Paxillin, p-FAK, and RhoA), by Western blot. β-actin was used as the control.
Abbreviations: RT-PCR, reverse transcription polymerase chain reaction; p-FAK, phospho-focal adhesion kinase; BGN, bioactive glass nanoparticle; DEX, dexamethasone; GAPDH, glyceraldehyde 3-phosphate dehydrogenase.
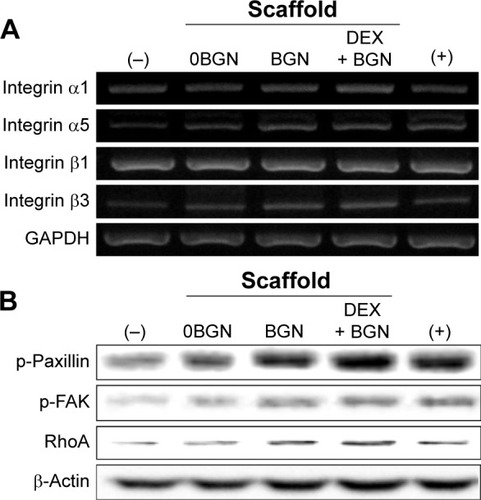
Figure 6 BMP-2 signaling pathway analyses.
Notes: (A) mRNA levels of BMP receptors (R1a, R1b, and R2) and BMP-2, as well as the protein expression of p-Smad1/5/8. (B) Inhibition study to verify the signaling pathway, where a BMP inhibitor, Noggin (10 µg/mL) was used to treat the cells for 1 hour, and then cultured for 2 days before Western blot analysis. Data are representative of three independent experiments.
Abbreviations: BMP, bone morphogenetic protein; BGN, bioactive glass nanoparticle; DEX, dexamethasone; GAPDH, glyceraldehyde 3-phosphate dehydrogenase; Nog, noggin.
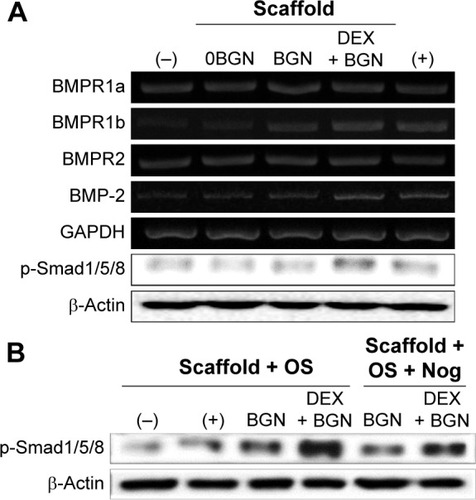
Figure 7 Akt/mTOR signaling pathway, analyzed by Western blot.
Notes: (A) Analysis of p-Akt, p-p70S6K, and p-4E-BP1. (B) Inhibition study to verify the signaling pathway, where cells were pretreated with rapamycin (100 ng/mL) for 1 hour and then incubated with samples for 30 minutes. Data are representative of three independent experiments.
Abbreviations: BGN, bioactive glass nanoparticle; DEX, dexamethasone; mTOR, mammalian target of rapamycin; RAPA, rapamycin.
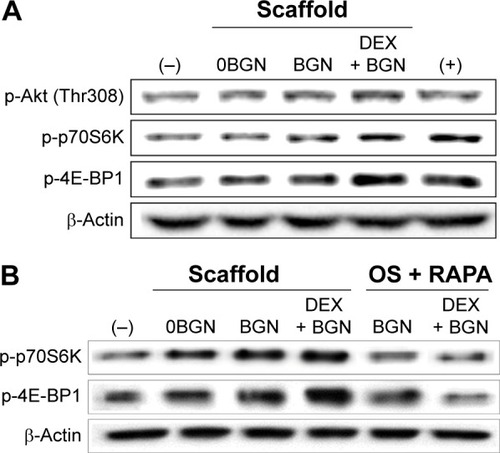
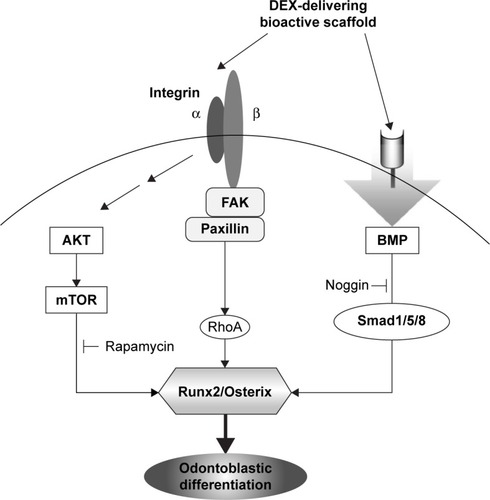
Figure 8 Schematic illustration showing the integrin, BMP, and mTOR signaling pathways triggered by the exposure to DEX-delivering bioactive nanofiber matrices, which ultimately stimulated the odontogenic differentiation of HDPCs.
Abbreviations: BMP, bone morphogenetic protein; DEX, dexamethasone; mTOR, mammalian target of rapamycin; HDPC, human dental pulp cell; FAK, focal adhesion kinase.