Figures & data
Table 1 Draper–Lin small composite design studied variables, response, and their levels
Table 2 Draper–Lin small composite design formulations and the observed values of the studied responses
Table 3 Estimated effects of factors, F-ratio, and associated P-values for the finasteride nanoparticles particle size (Y1) and solubility enhancement (Y2)
Figure 1 Standardized Pareto charts for the effect of the studied factors on Y1 and Y2.
Abbreviations: X1, stabilizer concentration; X2, miscible solvent ratio; X3, homogenization speed; X4, homogenization time; Y1, particle size (nm); Y2, solubility enhancement (%), X1X1, X2X2, X3X3, and X4X4 are the quadratic terms for the factors. X1X2, X1X3, X1X4, X2X3, X2X4, and X3X4 are the interaction terms between the factors.
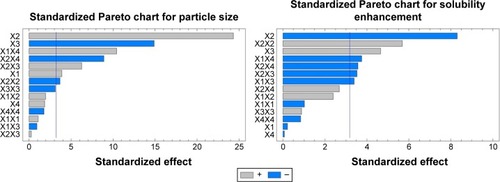
Figure 2 Estimated response surfaces along with contour plots for the effect of the studied factors on the particle size (A and B) and solubility enhancement (C and D).
Abbreviations: X1, stabilizer concentration; X2, miscible solvent ratio; X3, homogenization speed; X4, homogenization time.
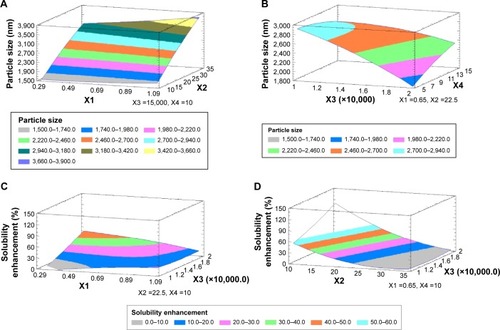
Figure 3 TEM image for the optimized finasteride nanoparticles formulation.
Abbreviation: TEM, transmission electron microscope.
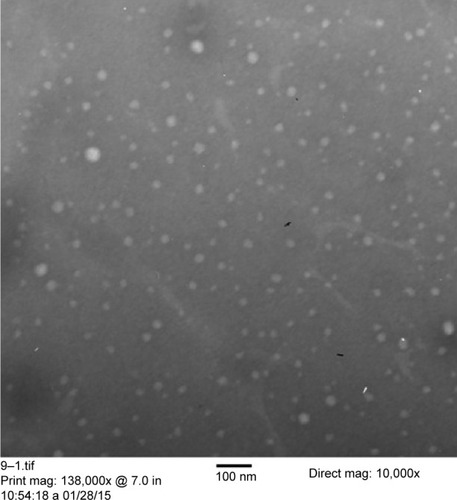
Figure 4 DSC thermogram of finasteride, PVA, physical mixture, and finasteride in the optimum formulation.
Abbreviations: DSC, differential scanning calorimetry; PVA, polyvinyl alcohol.
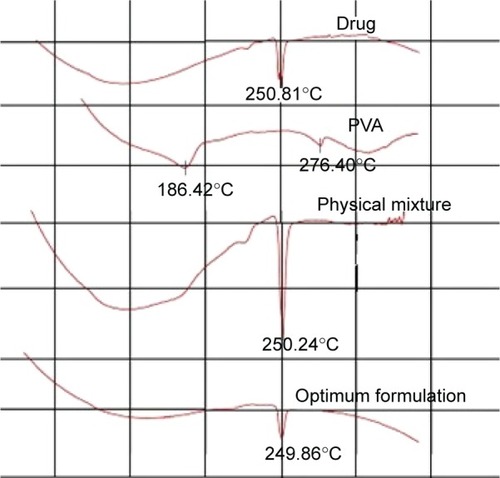
Figure 5 FTIR spectra of finasteride, PVA, physical mixture, and finasteride in the optimum formulation.
Abbreviations: FTIR, Fourier-transformed infrared; PVA, polyvinyl alcohol.
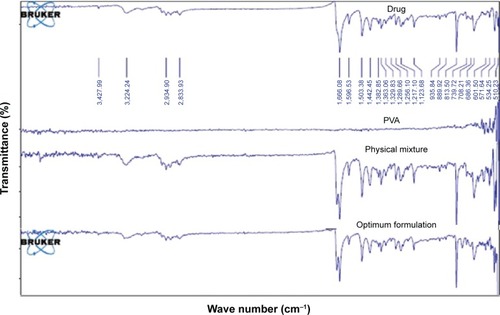
Figure 6 XRPD patterns of pure finasteride and drug nanoparticles.
Abbreviation: XRPD, X-ray powder diffraction.
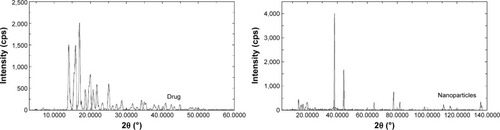
Table 4 Pharmacokinetic parameters of finasteride after administration of pure drug, drug microparticles, and optimized drug nanoparticles formulation of a single dose (0.4 mg/kg) given as oral suspension
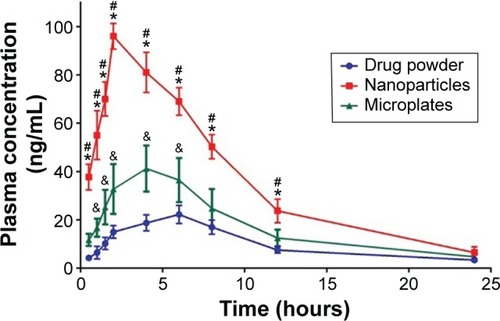
Figure 7 Plasma concentration–time curve following oral administration of the optimized finasteride formulation, pure drug in comparison, and drug microparticles.
Notes: The data represent the mean ± standard deviation (n=4). *Significant difference between nanosuspension with the pure drug. #Significant difference between nanosuspension with the microparticles. &Significant difference between the pure drug and microparticles.