Figures & data
Figure 1 Schematic diagram of material shape and the site of implantation. A) material shape B) the site of intramuscular implantation on the both sides of the spine. C) the site of endosseous implantation in the tibia.
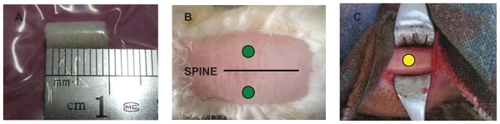
Figure 2 Macroscopic observations of intramuscular and endosseous implantation. (a–d: 2, 4, 12, and 26 weeks respectively after implantation in back muscles. e–f: 2, 4, 12, and 26 weeks respectively after implantation in tibia).
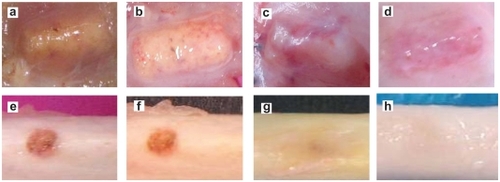
Figure 3 HE staining and Masson’s staining of material implanted in muscle. a, b–c, d, e–f were the histological reaction at 2, 4, 12 and 26 weeks respectively.
Abbreviations: B, bone lacuna; F, fibrous capsule.
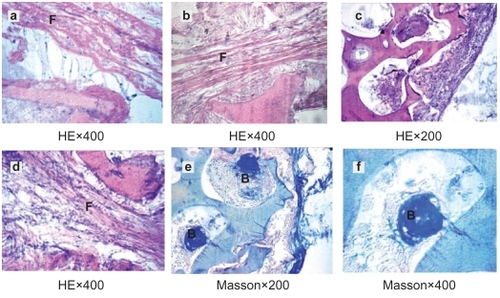
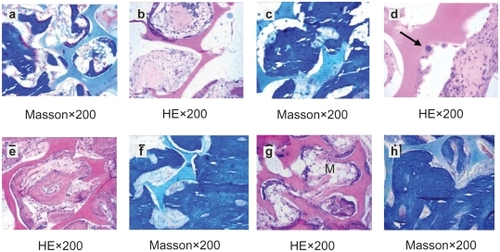
Figure 4 HE staining and Masson’s staining of material implanted in tibiae. a, b–d, e–f, g–h were the histological reaction at 2, 4, 12 and 26 weeks respectively. Arrow points to osteoblast.
Abbreviation: M, marrow cavity.