Figures & data
Figure 1 The mold-cast tensile specimens of PLGA, agglomerated nano-titania in PLGA composites (PTCa), well-dispersed nano-titania in PLGA composites (PTCd), agglomerated nano-HA in PLGA composites (PHAa), well-dispersed nano-HA in PLGA composites (PHAd) and the casting mold for tensile specimens. The tensile specimen gage length × width × thickness = 25 × 10 × 0.5 mm. The depth of the casting mold was designed as 10 mm.
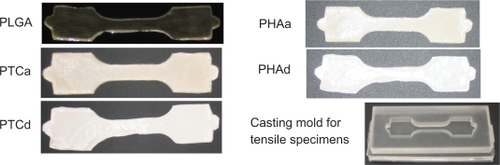
Figure 2 SEM micrographs of nano-titania and nano-titania/PLGA composites: (a) nano-titania, (b,c) PTCa (the agglomerated nano-titania in PLGA composites), (d,e) PTCd (the well-dispersed nano-titania in PLGA composites). (b,d) the top surface, (c,e) the bottom surface. Magnification bars: 1 μm.
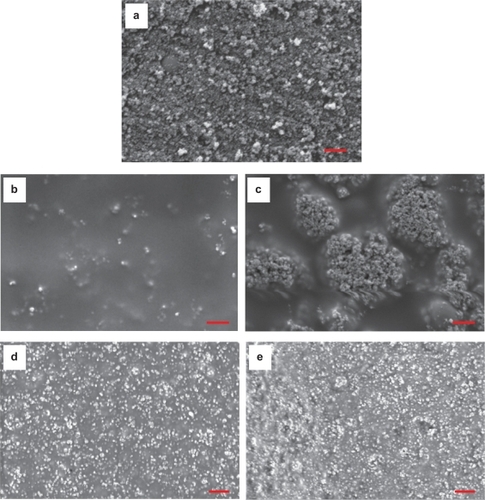
Figure 3 a SEM micrograph of particulate nano-HA synthesized by the wet chemistry method. (b,e) SEM micrographs of nano-HA/PLGA composites: (b,c) PHAa (the agglomerated nano-HA in PLGA composites); (d,e) PHAd (the well-dispersed nano-HA in PLGA composites). (b,d) the top surface, (c,e) the bottom surface. Original magnification: 100 kX. Magnification bars: 200 nm.
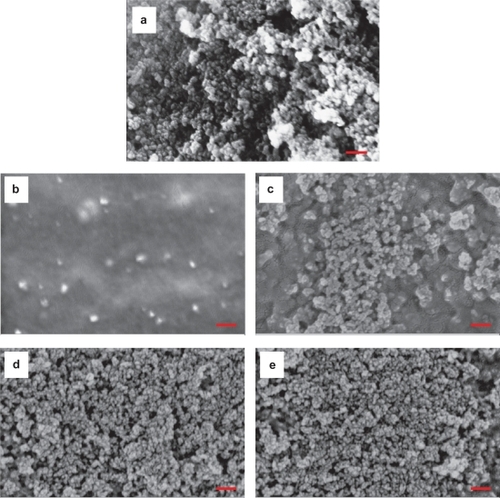
Figure 4 (a) The typical tensile stress-strain curves of PLGA, PTCa (the agglomerated nano-titania in PLGA composites) and PTCd (the well-dispersed nano-titania in PLGA composites) that were calculated from the load-extension data of tensile tests. (b) The tensile moduli of PLGA, PTCa and PTCd. (c) The tensile strength at yield and the ultimate tensile strength (UTS) of PLGA, PTCa and PTCd. (d) The elongation (unitless) at yield and (e) the elongation at break of PLGA, PTCa and PTCd. (f) The compressive moduli of PLGA, PTCa and PTCd. Values are mean ± SEM; n = 3; *p < 0.05 compared with PLGA; and **p < 0.05 compared with PTCa.
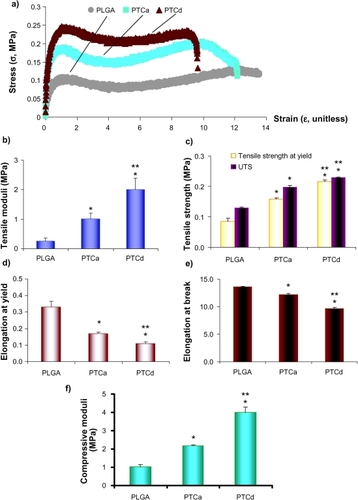
Figure 5 The typical tensile stress-strain curves of PLGA, PHAa (the agglomerated nano-HA in PLGA composites) and PHAd (the well-dispersed nano-HA in PLGA composites) that were calculated from the load-extension data of tensile tests.
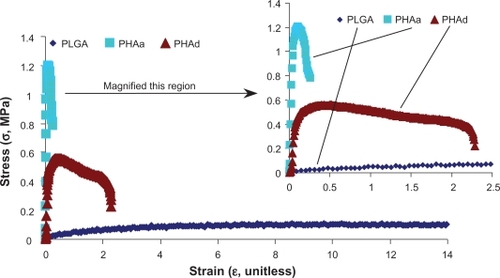
Figure 6 (a) The tensile moduli of PLGA, PHAa (the agglomerated nano-HA in PLGA composites) and PHAd (the well-dispersed nano-HA in PLGA composites). (b) The tensile strength at yield and the ultimate tensile strength (UTS) of PLGA, PHAa and PHAd. (c) The elongation (unitless) at yield and (d) the elongation at break of PLGA, PHAa and PHAd. (e) The compressive moduli of PLGA, PHAa, and PHAd. Values are mean ± SEM; n = 3; *p < 0.05 compared with PLGA; and **p < 0.05 compared with PHAa.
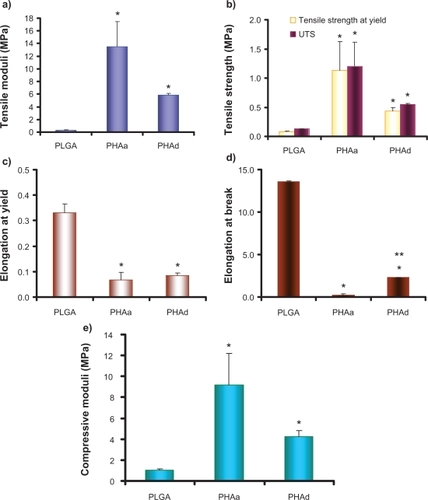
Figure 7 Microscopic fracture appearances of PLGA after tensile tests. Original magnifications are 1 kX for (a,b), 5 kX for (c,d) and 50 kX for (e,f). Magnification bars are 10 μm for (a,b), 2 μm for (c,d) and 200 nm for (e,f). F shows the direction of the load.
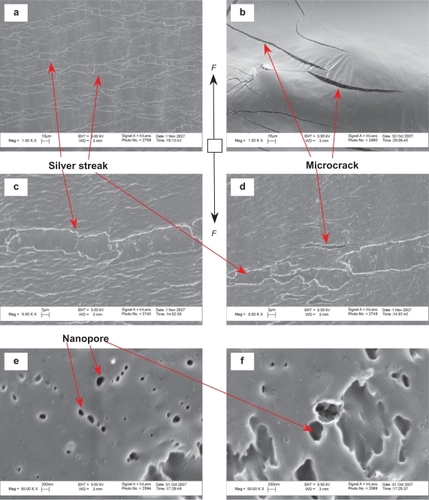
Figure 8 Microscopic fracture appearances of PTCa (agglomerated nano-titania in PLGA composites) after tensile tests. The fracture cross-section is shown in (a). The top surfaces of PTCa near the fracture cross-section are shown in (b,c,d). Original magnifications are 1 kX for (a), 5 kX for (b), 20 kX for c and 50 kX for (d). Magnification bars are 10 μm for (a), 2 μm for (b), 1 μm for (c) and 200 nm for (d). F shows the direction of the load.
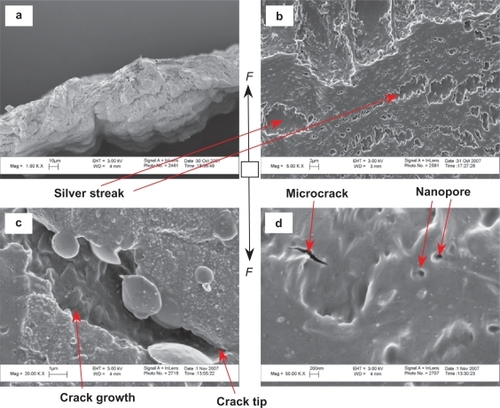
Figure 9 Microscopic fracture appearances of PTCa (agglomerated nano-titania in PLGA composites) after tensile tests. The bottom surfaces of the PTCa near the fracture cross-sections. Original magnifications are 10 kX for (a,b,c) and 50 kX for (d). Magnification bars are 2 μm for (a), 1 μm for (b,c) and 200 nm for (d). F shows the direction of the load.
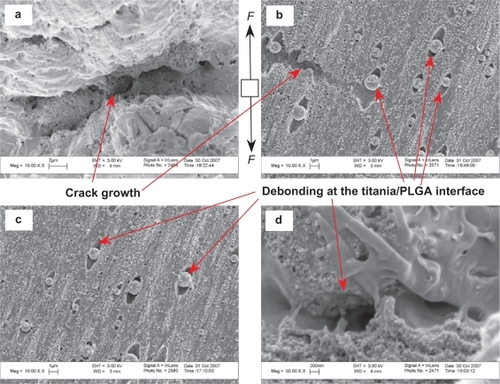
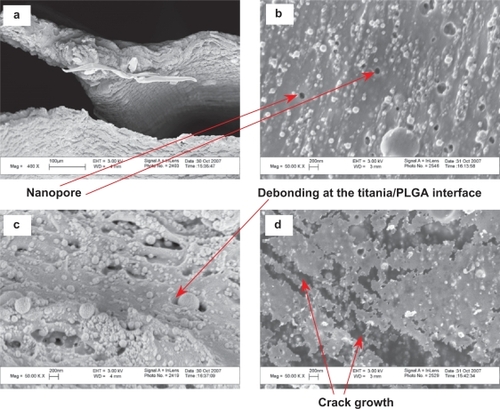
Figure 10 Microscopic fracture appearances of PTCd (well-dispersed nano-titania in PLGA composites) after tensile tests. The fracture cross-section is shown in (a). The top surfaces of PTCd near the fracture cross-section are shown in (b,c,d). Original magnifications are 400 X for (a) and 50 kX for (b,c,d). Magnification bars are 100 μm for (a) and 200 nm for (b,c,d).