Figures & data
Figure 1 Schematic illustration of nanosheets and their biofunctions.
Notes: (A) Schematic illustration of preparation of MnO2/HA/CDDP nanosheets; (B) the drug release in response to the pH decrease and the GSH increase in the tumor microenvironment; (C) the biofunctions of MnO2/HA/CDDP nanosheets.
Abbreviations: CDDP, cis-diamminedichloroplatinum; GSH, glutathione; HA, hyaluronic acid; MnO2, manganese dioxide; MRI, magnetic resonance imaging.
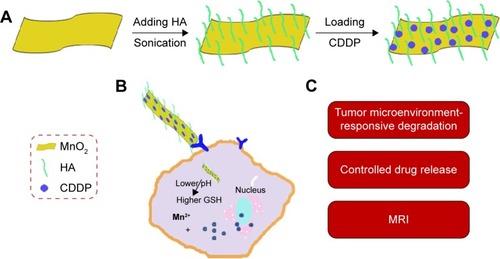
Figure 2 Characterization of MnO2 nanosheets.
Notes: (A) TEM images of synthesized MnO2 nanosheets; (B) HRTEM images of synthesized MnO2 nanosheets; (C) EDS pattern of synthesized MnO2 nanosheets; (D) zeta potential; (E) XPS spectra for the O 1s region; (F) XPS spectra for the Mn 2p region.
Abbreviations: EDS, energy-dispersive X-ray spectroscopy; HRTEM, high-resolution transmission electron microscopy; MnO2, manganese dioxide; TEM, transmission electron microscopy; XPS, X-ray photoelectron spectroscopy.
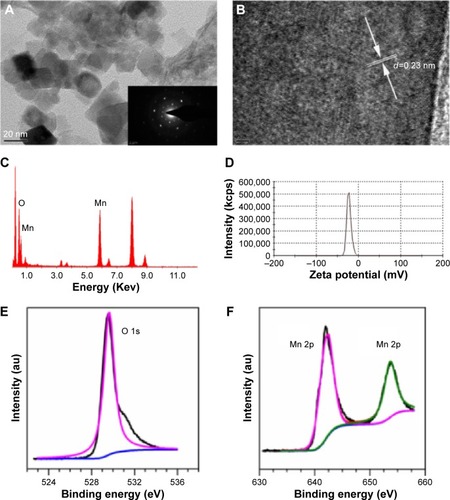
Figure 3 Characterization of MnO2/HA and MnO2/HA/CDDP.
Notes: (A) FTIR spectra of HA, MnO2, and MnO2/HA; (B) TGA curves of MnO2 and MnO2/HA; (C) loading efficiency of CDDP at different feed ratios.
Abbreviations: CDDP, cis-diamminedichloroplatinum; FTIR, Fourier-transform infrared; HA, hyaluronic acid; MnO2, manganese dioxide; TGA, thermogravimetric analysis.
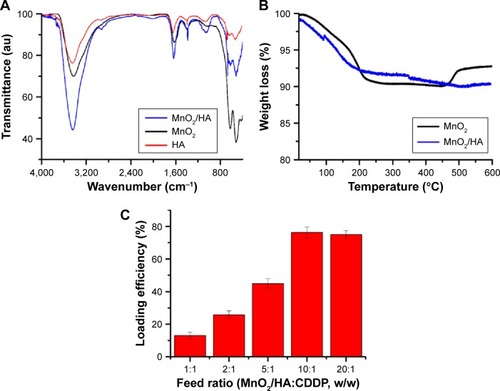
Figure 4 Characterization of MnO2/HA/CDDP.
Notes: (A) TEM images of MnO2/HA/CDDP; (B) EDS pattern of MnO2/HA/CDDP; (C) size distribution; (D) zeta potential; (E) appearance of MnO2 and MnO2/HA/CDDP dispersed in pure water and saline, respectively, at day 0; (F) appearance of MnO2 and MnO2/HA/CDDP dispersed in pure water and saline, respectively, at day 3. (a) MnO2 dispersed in pure water; (b) MnO2 dispersed in saline; (c) MnO2/HA/CDDP dispersed in pure water; (d) MnO2/HA/CDDP dispersed in saline. (G) in vitro release profiles of CDDP from MnO2/HA/CDDP nanosheets at different release media.
Abbreviations: CDDP, cis-diamminedichloroplatinum; EDS, energy-dispersive X-ray spectroscopy; GSH, glutathione; HA, hyaluronic acid; MnO2, manganese dioxide; TEM, transmission electron microscopy.
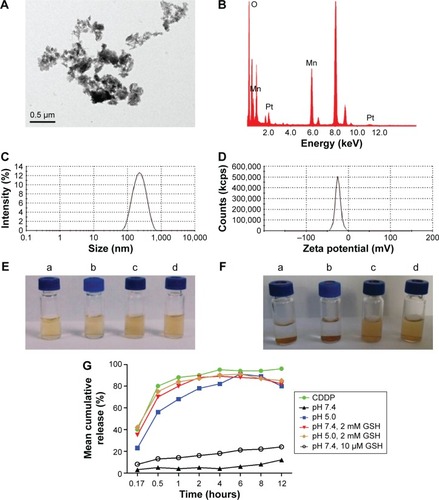
Figure 5 In vitro MRI.
Notes: (A) T1-weighted images; (B) mean MRI signal intensity; (C) relaxation rate r1 (1/T1) versus molar concentrations of an aqueous suspension of MnO2/HA/CDDP at pH 7.4 and pH 5.0 containing 2 mM GSH, respectively.
Abbreviations: CDDP, cis-diamminedichloroplatinum; GSH, glutathione; HA, hyaluronic acid; MnCl2, manganese chloride; MnO2, manganese dioxide; MRI, magnetic resonance imaging.
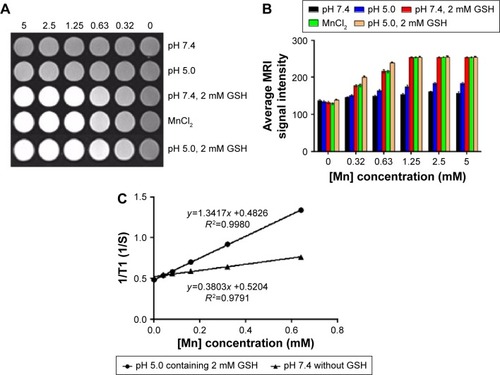
Figure 6 Flow cytometry analysis of A549 cells exposed to free Cy 5.5, MnO2/HA/Cy 5.5 for different times.
Notes: (A) Cy 5.5 group; (B) MnO2/HA/Cy 5.5 group.
Abbreviations: HA, hyaluronic acid; MnO2, manganese dioxide; Cy, Cyanine dye.
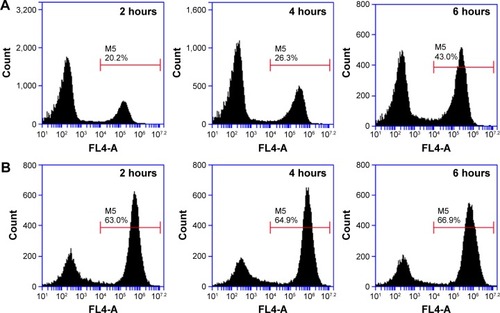
Figure 7 CLSM images of A549 cancer cells after the uptake of MnO2/HA/Cy 5.5 (A), free Cy 5.5 (B) at the equivalent Cy 5.5 concentration of 5 μg/mL at 4 hours.
Abbreviations: CLSM, confocal laser scanning microscopy; DAPI, 4′,6-diamidino-2-phenylindole; HA, hyaluronic acid; MnO2, manganese dioxide; Cy, Cyanine dye.
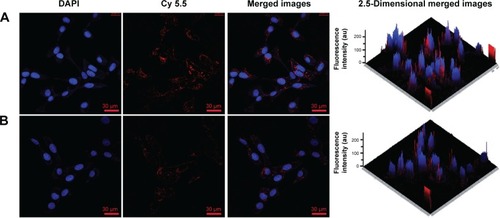
Figure 8 Cell cytotoxicity.
Notes: (A) A549 cell viabilities after incubation with MnO2/HA for 24 hours and 48 hours; (B) A549 cell viabilities after incubation with CDDP and MnO2/HA/CDDP for 24 hours; (C) A549 cell viabilities after incubation with CDDP and MnO2/HA/CDDP for 48 hours. *P<0.05; **P<0.01.
Abbreviations: CDDP, cis-diamminedichloroplatinum; HA, hyaluronic acid; MnO2, manganese dioxide.
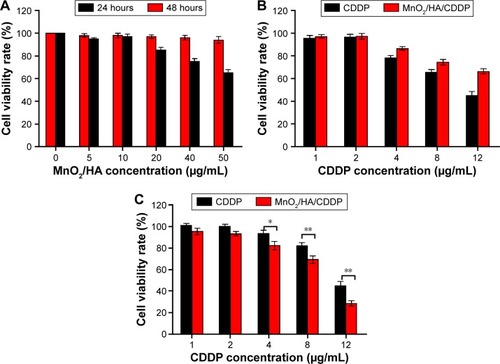
Figure 9 Cell cycle and cell apoptosis analysis.
Notes: (A) Cell cycle analysis; (B) cell apoptosis determined by DAPI staining: (a) control group; (b) MnO2/HA group; (c) CDDP group; (d) MnO2/HA/CDDP group.
Abbreviations: CDDP, cis-diamminedichloroplatinum; DAPI, 4′,6-diamidino-2-phenylindole; HA, hyaluronic acid; MnO2, manganese dioxide.
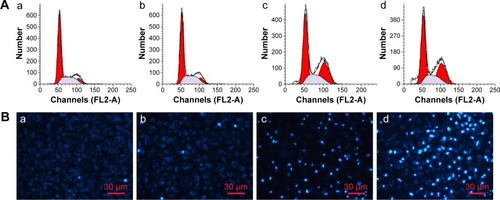
Figure 10 In vivo NIR fluorescence imaging.
Notes: (A) Cy 5.5-labeled MnO2/HA/CDDP group; (B) free Cy 5.5 group. The red semi-circles refer to the tumor site.
Abbreviations: CDDP, cis-diamminedichloroplatinum; HA, hyaluronic acid; MnO2, manganese dioxide; NIR, near infrared; Cy, Cyanine dye.
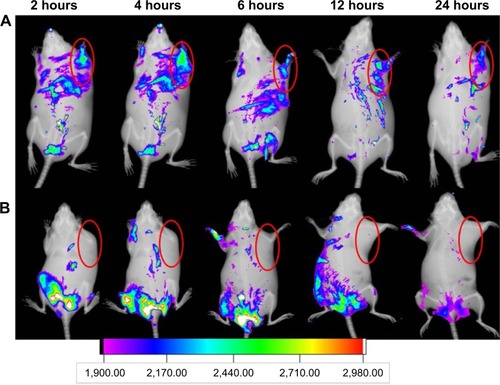
Figure 11 In vivo T1-weighted MRI and pharmacokinetic properties.
Notes: (A) In vivo T1-weighted MRI of tumor-bearing mice under different treatments; (B) average MRI signal intensity of each group; (C) plasma concentration–time curves of CDDP after intravenous injection of free CDDP solution and MnO2/HA/CDDP nanosheets, respectively. (a) Control mice; (b) 4 hours after intratumoral injection with MnO2/HA/CDDP; (c) 4 hours after intravenous injection with MnO2/HA/CDDP. *P<0.05; **P<0.01. The red semi-circles refer to the tumor site.
Abbreviations: CDDP, cis-diamminedichloroplatinum; HA, hyaluronic acid; MnO2, manganese dioxide; MRI, magnetic resonance imaging.
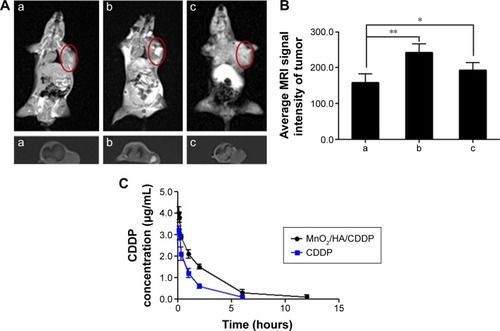
Table 1 Pharmacokinetic parameters
Figure 12 In vivo antitumor effect.
Notes: (A) Body weight of tumor-bearing mice as a function of time; (B) relative tumor volumes of tumor-bearing mice at different times; (C) H&E-stained tumor tissues harvested from the mice under different treatments; (D) H&E-stained kidney tissues harvested from the mice under different treatments; (a) control group; (b) MnO2/HA group; (c) CDDP group; (d) MnO2/HA/CDDP group. The scale bar is 100 μm. *P<0.05.
Abbreviations: CDDP, cis-diamminedichloroplatinum; HA, hyaluronic acid; H&E, hematoxylin and eosin; MnO2, manganese dioxide; V, tumor volume at a certain day; V0, initial tumor volume.
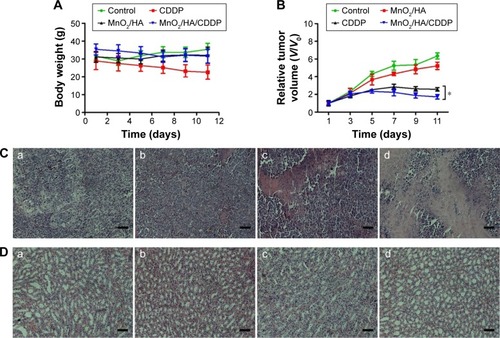
Figure S1 XRD spectrum of MnO2 nanosheets.
Abbreviations: MnO2, manganese dioxide; XRD, X-ray diffraction.
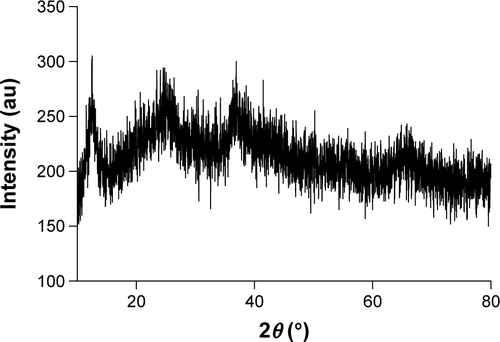
Figure S2 The interaction between CDDP and HA.
Notes: (A) The interaction of CDDP with carboxyl groups in HA from adjacent nanosheets. (B) The weakening of the metal–carboxylate bond via protonation of the carboxylic groups of the HA units.
Abbreviations: CDDP, cis-diamminedichloroplatinum; HA, hyaluronic acid.
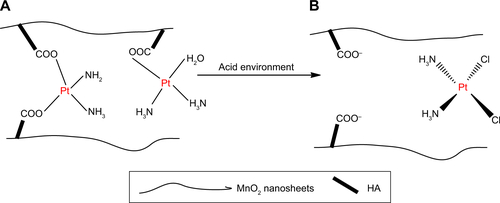
Figure S3 The color change of different formulations under various conditions.
Notes: The images of MnO2/HA/CDDP in pH 5.0 (A), reductive pH 7.4 PBS containing 2 mM GSH (B) and pH 5.0 containing 2 mM GSH (C). (D) The appearance of the dialysis tubing after 12-hour dialysis for the in vitro release experiment.
Abbreviations: CDDP, cis-diamminedichloroplatinum; GSH, reduced glutathione; HA, hyaluronic acid; MnO2, manganese dioxide; PBS, phosphate-buffered saline.
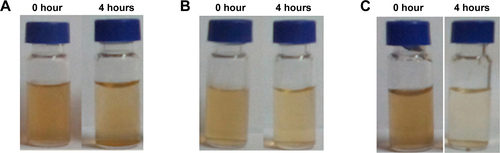
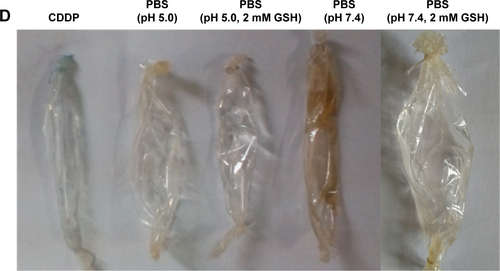
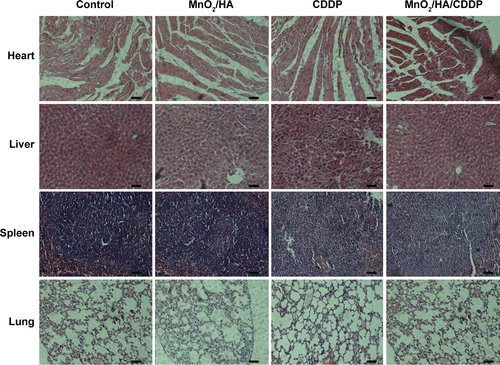
Figure S4 H&E staining of major organs from different groups (200×).
Abbreviations: CDDP, cis-diamminedichloroplatinum; HA, hyaluronic acid; H&E, hematoxylin and eosin; MnO2, manganese dioxide.