Figures & data
Table 1 Differences in characteristics between studied analytic sample and total dialysis patients in Japan during each survey year
Table 2 Summary statistics for dialysis complications, depressive symptoms, level-1 variables, and level-2 variables among aggregated data from 1996 to 2011 surveys after raking adjustment
Table 3 Differences between respondents below the first quartile income and ones over the fourth quartile in the number of dialysis complications and depressive symptoms among aggregated data from 1996 to 2011 after raking adjustment
Figure 1 Differences by age categories in relative risk of dialysis complications in first-income quartile respondents compared to fourth-quartile respondents.
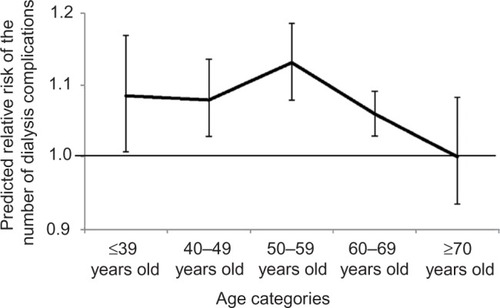
Table 4 Effect of age and period on the income differences in the number of dialysis complications and depressive symptoms: results from cross-classified random-effects two-level modelTable Footnotea
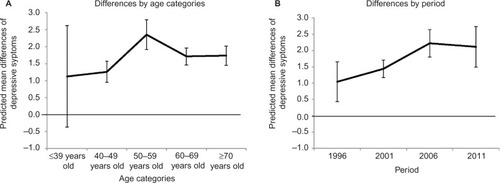
Figure 2 Mean differences by age categories or period for depressive symptoms between respondents below the first income quartile and ones over the fourth quartile.