Figures & data
Figure 1 A PAS-stained, freeze-substituted normal kidney, showing the superficial cortex.
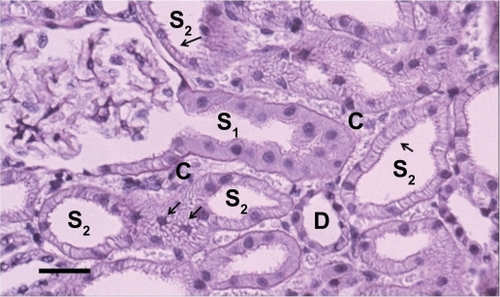
Figure 2 A freeze-substituted normal kidney, showing the superficial cortex.
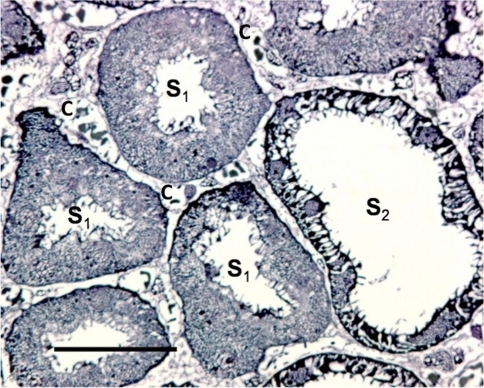
Figure 2B An enlarged region of . Please note the net-like structure in the nuclear content connecting the nucleolus to the nuclear membrane of the S1 cell (see arrows). The scale bar represents 25 μm.
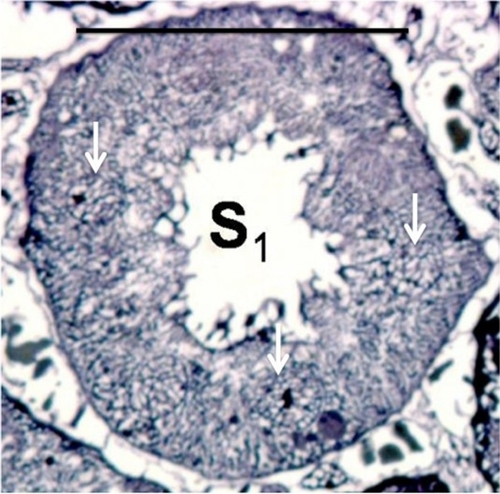
Figure 3 A freeze-dried normal kidney, vitally stained using methylene blue revealing the superficial cortex.
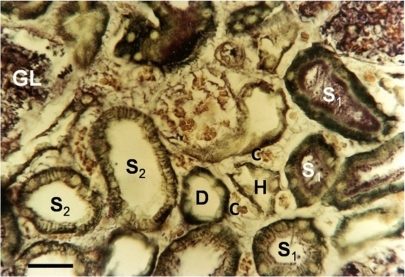
Figure 4 A PAS-stained freeze-substituted normal kidney showing the subcapsular area of the cortex.
Notes: A) The superficial fractions of the S2 segments, placed just beneath the renal capsule (RC) do not possess the usual basolateral spaces, normally seen in S2 segments (see arrows). In this segment, the angularly shaped, or gear-wheel like nuclei can only be seen in areas where the intercellular basolateral space is present. V = a Venole located between two S1 segment loops, the location of which is consistent with the previously described tubulo-vascular counter-current flow in the proximal convoluted tubule (Faarup et alCitation13). RC denotes the renal capsule. B) A PAS-stained, freeze-substituted kidney showing a S2 tubular loop, located just beneath the renal capsule (RC). The fraction of the loop that is in contact with the capsule is lacking a basolateral interstitial space between the cells, although this is to be found both before as well as after the region of capsular contact. RC denotes the renal capsule. The scale bar represents 25 μm.
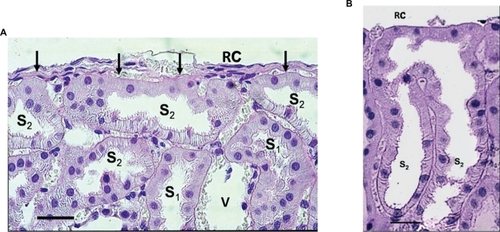
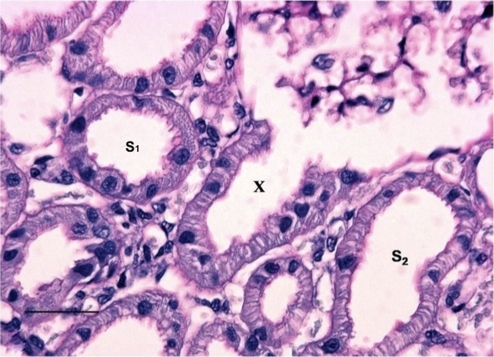
Figure 5. A PAS-stained freeze-substituted normal kidney showing a juxtamedullary nephron.
Notes: The cells in the proximal tubular loop (X), descending from the glomerulus, have a typical S2-like structure. The scale bar represents 25 μm.
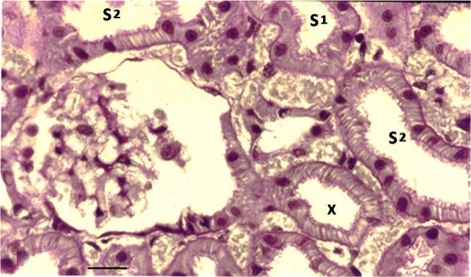
Figure 6 A PAS-stained freeze-substituted kidney, showing the superficial cortex from a rat that had been exposed to a heavy salt-loading of short duration (Group 2 C).
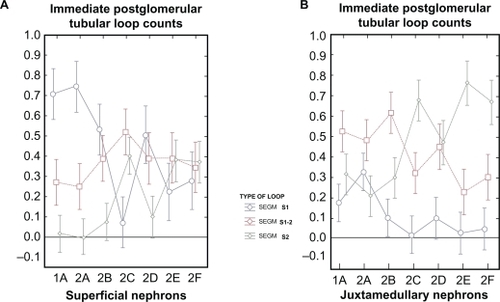
Graph I. Quantitative segmental evaluation of the immediate postglomerular fraction of the proximal convoluted tubule in freeze-substituted tissue from the renal cortex.
Notes: 1A) Among the superficial nephrons from normal kidneys (Group 1A) the number of S1-like cells far exceeds that of the S1-2 like cells, which are themselves significantly more frequent than the S2-like cells. Moderate salt depletion or salt loading over a period of 1 month (Groups 2A and 2B) does not change the distribution significantly. However, a heavy salt loading of short duration (1 hour) (Group 2C) significantly reverses the frequencies of the S1, S1-2 and S2-like cells such that the presence of the S1-like structured cells falls far below the number of S1-2-like and S2-like cells in this part of the tubule. After a temporary, yet significant reversal of the structural changes in the S1- and S2-like structures some 48 hours later, the presence of both S1-, S1-2 and S2-like cells becomes nearly identical (see Groups 2D, E and F) 2 days, 2 weeks or 4 weeks after the acute intervention of the heavy salt loading. 1B) In the juxtamedullary located nephrons from freeze substituted normal kidneys the presence of both the S1-like, and the S2-like cells of the immediately postglomerular located fraction of the proximal convoluted tubule were lower in number than the S1-2 like cells (Group 1A). No significant changes were found during moderate salt depletion or salt loading(Groups 2A and B). After a heavy salt loading of short duration (Group 2C) the S1-like cells were nearly totally eliminated, and the S2-like cells were increased in number significantly, to subsequently comprise two thirds of the structure in this region. Interestingly, even 4 weeks later the Control Group (F) did not show any change in this distribution.
Graph 2 The percentage segmental distribution of the total loops from the proximal convoluted tubule of the renal cortex of freeze-substituted kidneys.
Notes: 2A) In the superficially located nephrons of normal kidneys (Group 1A) the S2-like cells in the loops were significantly more frequent than the S1-, and S1-2 like cells, which were found to be equally frequent. Slight salt depletion or salt loading did not change these values significantly (Group 2A and B). However, after a heavy salt loading of short duration (Group 2C) the frequency of S2-like cells was elevated from about 40 % to more than 80 %. In accordance, the number of S1- and S1-2 like cells were reduced to around 10 % of the total. Moreover, even 4 weeks later in the Control (Groups 2F) values were found to return to those seen in normal kidneys (see “normal” - Group 1A). 2B) In juxtamedullary located nephrons in freeze-substituted kidneys the normal kidneys (Group A) revealed a number of S1-like cells that were slightly lower than those in the superficial nephrons (Graph 2A), otherwise, the distribution was rather similar. No significant changes were found with moderate salt depletion or salt loading (Groups 2A and B). However, a heavy salt loading of short duration (Group 2C) induced the number of S2-like cells to become clearly elevated in percentage terms. S1-like and S1-2 like cells were concomitantly reduced in proportion. Notably though these structural changes did not normalize, even in the Controls up to 4 weeks later (Group 2F).
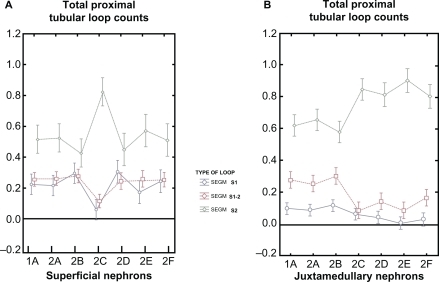
Figure 7 A PAS-stained, freeze-substituted normal kidney (Group 1A).
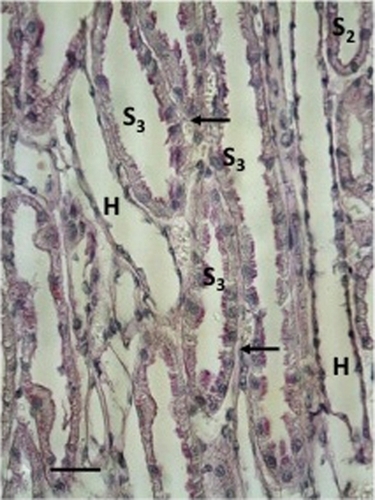
Figure 8 A freeze-substituted and PAS-stained kidney investigated immediately after a heavy salt-loading of short duration (Group 2C).
Figure 9 A freeze-substituted and PAS-stained kidney two days following a heavy salt loading of short duration (Group 2F).
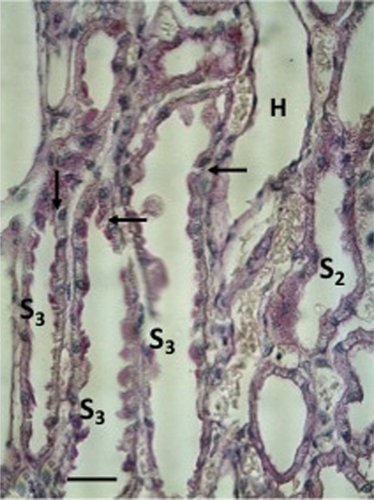
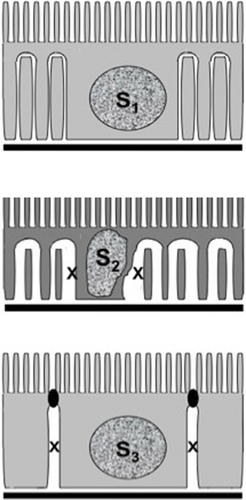
Figure 10 Essential structural features distinguishing the three segments of the proximal tubule: Upper: S1; Middle: S2; and Lower: S3. Only in the S2 and S3 segments is an enlargement of the basolateral or lateral space (marked with an X) seen in cryopreparations of the tissue (compared with and –).