
Figures & data
Figure 1 Manifestations of thrombotic microangiopathy and the clinical presentations of end-organ damage. Data from references.Citation3–Citation16
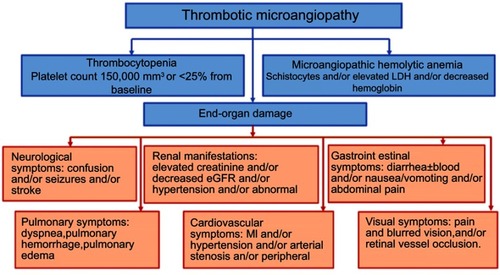
Figure 2 The alternative complement pathway in atypical hemolytic uremic syndrome and the associated genetic mutations.
Abbreviations: CFB, complement factor B; CFD, complement factor D; CFI, complement factor I; CFH, complement factor H; MCP, membrane cofactor protein; THBD, thrombomodulin; MAC, membrane attack complex; CFHR, complement factor receptor; PLG, plasminogen; INF2, Inverted Formin 2; aHUS, atypical hemolytic uremic syndrome.
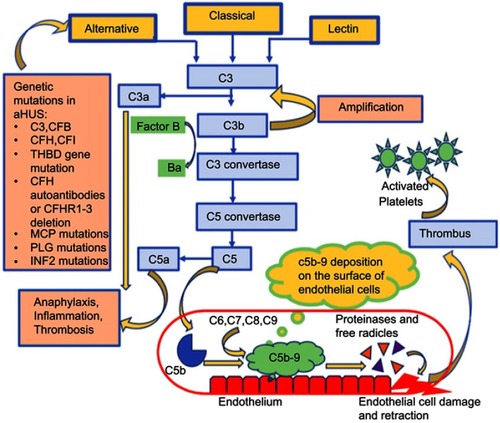
Table 1 Dosing regimen for eculizumab in patients with atypical hemolytic uremic syndrome
Figure 3 Sustained increase in platelet count during ongoing eculizumab treatment in trial 1 data (from Soliris (Eculizumab) highlights of prescribing information. US Food and Drug Administration. 2007. Available from: https://www.accessdata.fda.gov/drugsatfda_docs/label/2011/125166s172lbl.pdfCitation36) (bars represent SD); normalization of platelet count was defined as count >150±109/L).
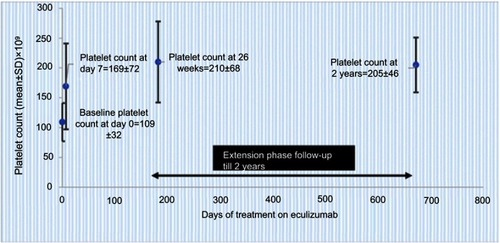
Figure 4 Improved renal function through 2 years with ongoing eculizumab treatment in trial 2 data (from Soliris (Eculizumab) highlights of prescribing information. US Food and Drug Administration. 2007. Available from: https://www.accessdata.fda.gov/drugsatfda_docs/label/2011/125166s172lbl.pdfCitation36) (bars represent SD); normalization of platelet count was defined as count >150±109/L).
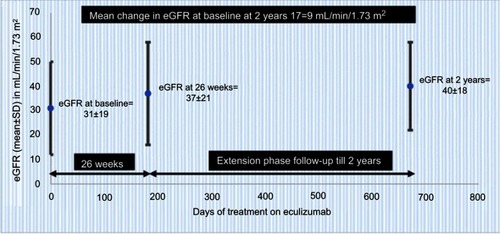
Figure 5 Markers evaluated at baseline in patients with aHUSCitation41
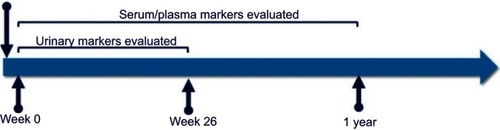
Table 2 Clinical trials and studies on eculizumab
Table 3 Monitoring of eculizumab therapy and complement activity in atypical hemolytic uremic syndrome (aHUS)
Table 4 Studies describing the outcome of eculizumab regimen discontinuation in aHUS patients
Table 5 Frequency of patients with mutations and ESRD in aHUS