Figures & data
Figure 1 Individual values of plasma aldosterone, active renin mass concentration (ARC) and aldosterone to renin ratio (ARR) in the three groups.
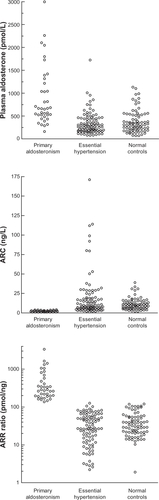
Figure 2 Analysis of receiver-operating characteristic curves. Circle, plasma aldosterone; triangle, active renin mass concentration; square, aldosterone to renin ratio.
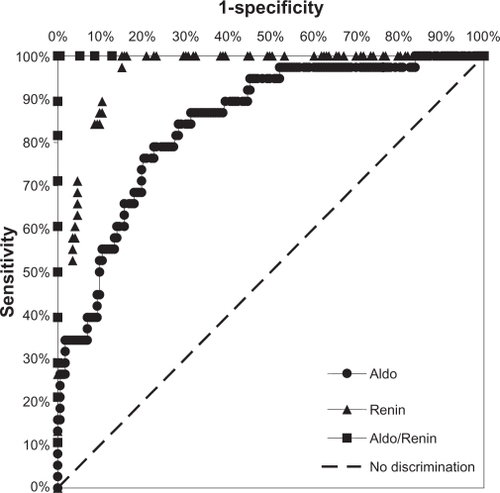
Table 1 Clinical and biochemical data
Table 2 Comparison of cutoff values derived from the upper limits of laboratory references or 95th percentile values and those from the receiver-operator characteristic curve
Table 3 Area under the receiver-operator characteristic curve ± standard error of the mean and confidence intervals
Table 4 Suggested screening thresholds for aldosterone-to-renin ratio using active renin mass concentration (pmol/ng)