
Figures & data
Figure 1 Diagram of study design.
Abbreviations: PD, peritoneal dialysis; VAS, visual analog scale.
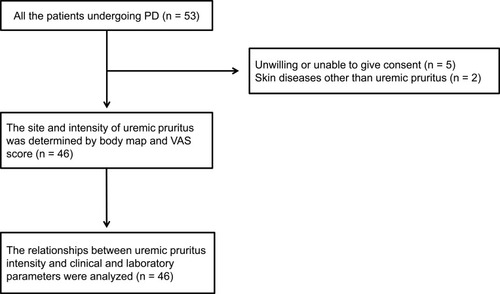
Figure 2 Body map for assessing sites of uremic pruritus and prevalence of uremic pruritus by body region. Regions: head and neck, chest and abdomen, back, upper limbs, and lower limbs.
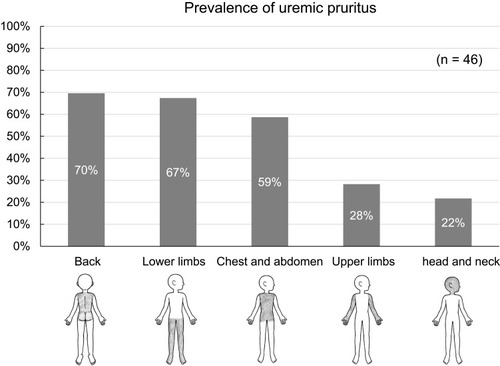
Table 1 Patients’ Characteristics
Figure 3 Distribution of patients by VAS scores in the daytime (A) and nighttime (B).
Abbreviation: VAS, visual analog scale.
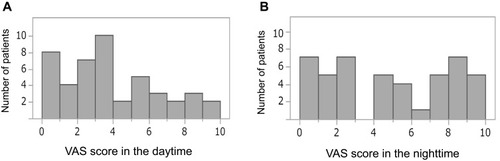
Figure 4 Comparison of uremic pruritus intensities in the daytime and nighttime.
Abbreviation: VAS, visual analog scale.
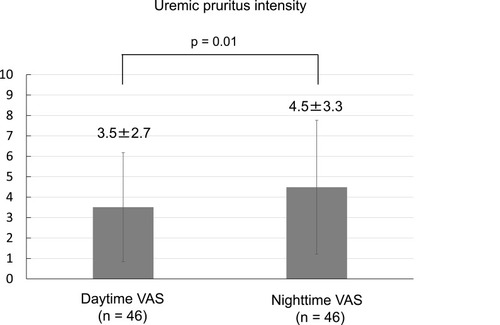
Table 2 Simple Linear Regression Analyses of the Variables Correlated with Uremic Pruritus Intensity in the Daytime
Table 3 Simple and Multiple Linear Regression Analyses of the Variables Correlated with Uremic Pruritus Intensity in the Nighttime