Figures & data
Table 1 Definition of Disease Stages in jck Mice and LPK Rats
Table 2 Primary and Secondary Antibodies Used for Immunohistochemical Analysis
Table 3 Scoring Method to Assess the Degree of Collagen Deposition or CD34 Immunostaining
Figure 1 Representative photomicrographs of the renal cortex and medulla in normal Lewis rats using RECA-1 immunostaining (brown) showing the extensive peritubular and glomerular staining. (A) Renal cortex in Lewis rats at week 6 (100x) (B) Renal outer medulla in Lewis rats at week 6 (100x); (C) Renal inner medulla in Lewis rat at week 6 (100x). Arrows show examples of positive immunoreactivity for RECA-1 in the tubulointerstitium.
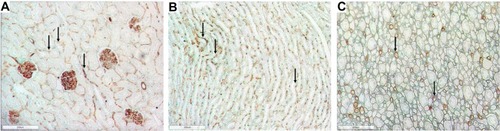
Figure 2 Photomicrographs of the renal cortex in LPK rats using RECA-1 immunostaining showing extensive peritubular capillary loss with cyst expansion and sporadic vessel formation in renal cortex. (A) Week 3 (100x); (B) Week 6 (100x); (C) Week 12 (100x) and (D) Week 24 (100x). Examples of sporadic vessels are indicated by arrows.
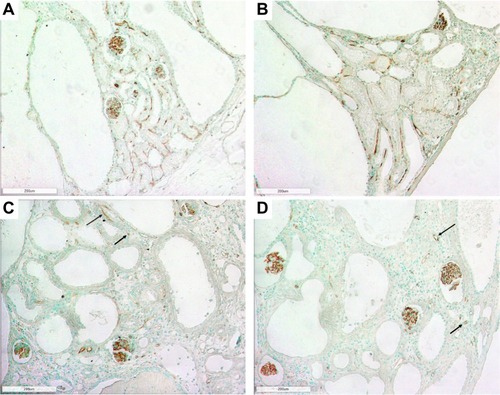
Figure 3 Photomicrographs of the renal outer medulla in LPK rats using RECA-1 immunostaining showing the loss of vasa recta with cyst expansion. (A) Week 3 (100x); (B) Week 6 (100x); (C) Week 12 (100x); (D) Week 24 (100x). Examples of limited areas of RECA-1 immunoreactivity are shown by arrows.
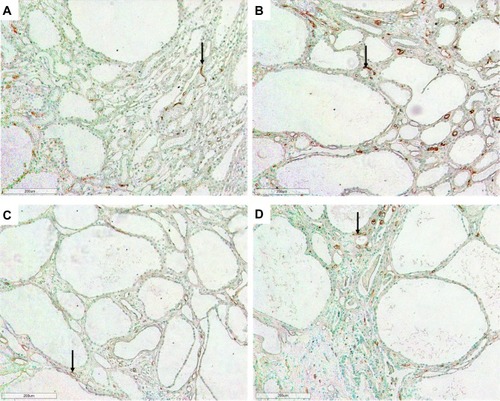
Figure 4 Photomicrographs of Lewis and LPK rats using RECA-1 immunostaining showing vascular bundles. Normal vascular bundles seen in Lewis rat at (A) week 6 (200x), (B) week 12 (200x) and (C) week 24 (200x). (D) Focal vascular bundles with dilated vessels (shown in brackets) in LPK rats at week 6 (200x). (E) Focal vascular networks (shown in brackets) in LPK rats at week 12 (200x). (F) Focal vascular bundles (shown in brackets) in LPK rats at week 24 (200x).
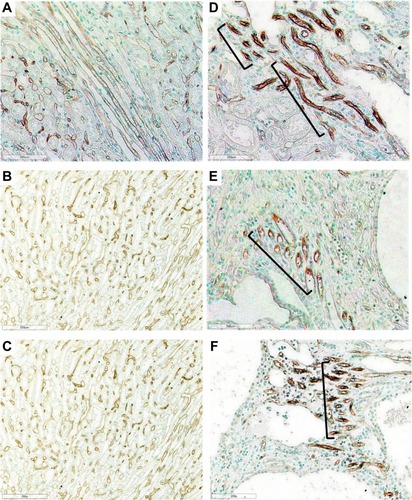
Figure 5 Photomicrographs showing vascular remodelling and angiogenesis using CD34 immunostaining in jck mice. The images from top to bottom show wild-type mice at week 4 and jck mice at weeks 4, 8 and 12, and the respective vessels of the cortex (first column, 200x), ISOM (centre column, 200x) and vascular bundles (last column, 100x).
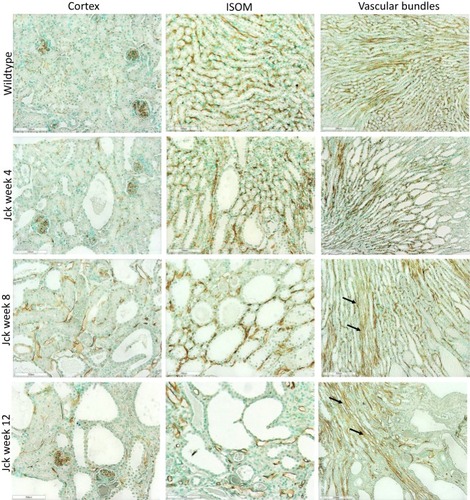
Figure 6 Semi-quantitative analysis of CD34 immunostaining in wild type and jck mice at weeks 4, 8 and 12. Data are expressed as mean ± standard error; *P<0.05 compared to respective groups.
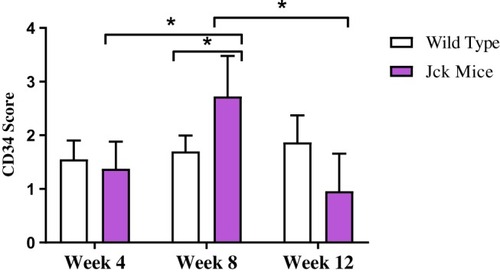
Figure 7 Representative photomicrographs showing angiogenesis using CD34 immunostaining in the outer medulla and cortex of jck mice. (A) Vessels within the epithelial lining of a cyst in the cortex at week 8 of a jck mouse are shown by arrows (600x); (B) Vessels with a corkscrew appearance in the outer medulla at week 12 of a jck mouse (indicated by brackets) (400x); and (C) Vascular bundle with dilated vessels at week 12 of a jck mouse (200x).
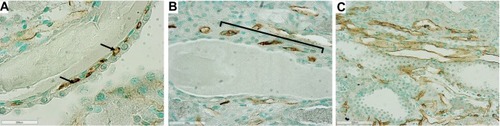
Figure 8 Effect of sirolimus (sir) compared to the vehicle (tap water) on the progression of PKD in LPK rats and jck mice. (A) Effect of sirolimus on percentage 2KW/BW ratio in LPK rats; (B) Effect of sirolimus on the percentage 2KW/BW ratio in jck mice; (C) Percentage cyst area in jck mice (D) Degree of collagen deposition in jck (vehicle/sirolimus treated) and control mice. *P<0.05 and **P<0.001. 2KW/BW: two kidney weight to bodyweight ratio.
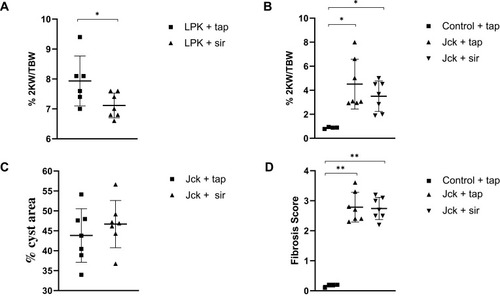
Figure 9 Effect of sirolimus (sir) compared to the vehicle (tap water) on the renal microvasculature using semi-quantitative analysis of CD34 immunostaining. **P<0.001.
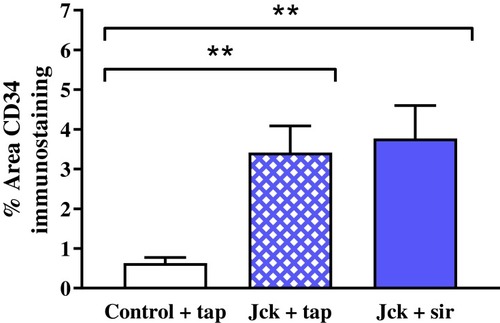
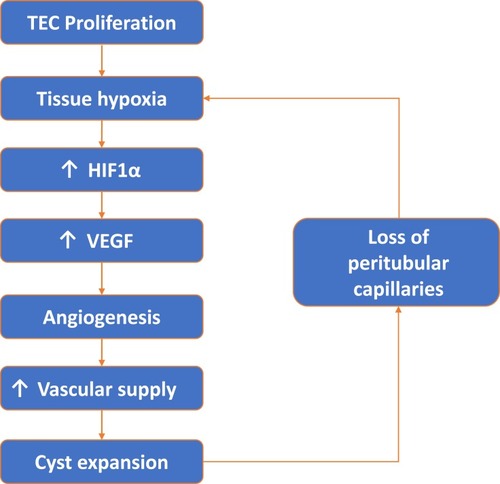
Figure 10 Vicious cycle of tubular epithelial cell (TEC) proliferation, tissue hypoxia, angiogenesis and peritubular capillary loss.