
Figures & data
Figure 1 Set-up before measurement. (A) Mouse is placed in right lateral decubitus and the kidney is externalized and placed in a kidney cup. (B) Ventral face of left kidney and left renal artery (white arrow), which divides in two and travels above the renal vein.
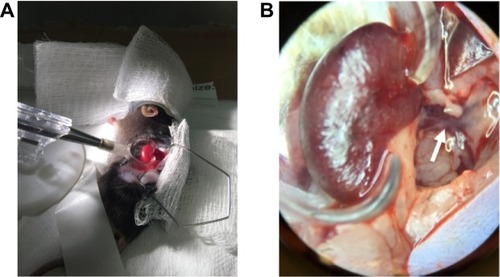
Figure 2 Laser speckle-contrast imaging of the kidney. (A) Kidney before occlusion. (B) Drop in blood-flow during occlusion. (C) Example of degraded outflow. (D) Hemi-kidney not vascularized.
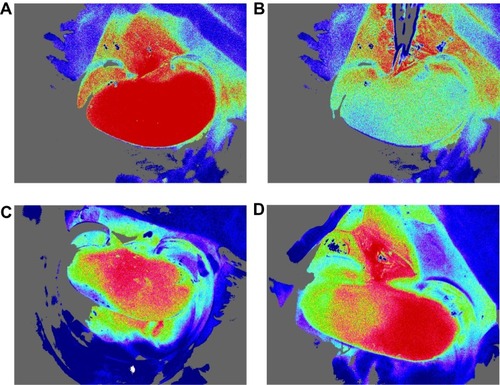
Figure 3 Basal blood-flow in control and Ang-II-treated mice. Data are presented as box plots. The three horizontal lines in the boxes are the 25th, 50th and 75th percentiles. The two lines outside the boxes represent the highest and lowest values. PU: perfusion unit. Asterisk indicates significant blood-flow differences at p < 0.05 level between control and Ang-II-treated mice.
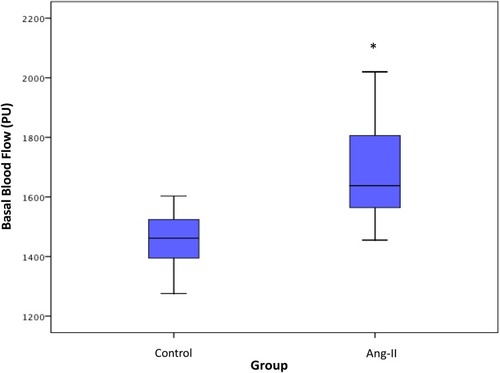
Table 1 Results of Laser Speckle-Contrast Analysis Measurements, in All 23 Mice, and in Control and Ang-II-Treated Mice. Data are Mean and Standard Deviation