
Figures & data
Table 1 The Demographic and Relevant Clinical Data of the Patients at the Beginning of the Study
Figure 1 Changes of pruritus severity based on the visual analogue scale (VAS) at different time points during the study (P-value<0.001).
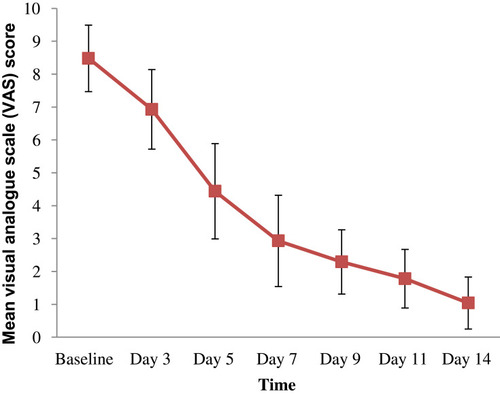
Table 2 The Values of VAS and SIS at Different Time Points During the Study
Table 3 Distribution of Severity of Pruritus by 4-Point Classification System Before and After Treatment with Mirtazapine
Figure 2 Mean sleep interference score at different time points during the study period (P-value<0.001).
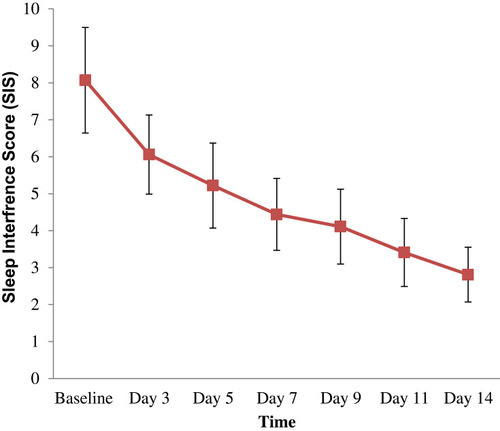
Table 4 Serum Levels of Histamine and Serotonin Before and After the Treatment