
Figures & data
Figure 1 The relative number of angiotensin II AT1-B receptors on the SMCs of normal kidney arterioles (single values + mean, Mann–Whitney test). Reproduced with permission from Razga Z, Nyengaard JR. Up- and down-regulation of angiotensin II AT(1)-A and AT(1)-B receptors in afferent and efferent rat kidney arterioles. Journal of the Renin-Angiotensin-Aldosterone System 2008; 9: 196–201. Copyright © 2008, © SAGE Publications.Citation15 The significant differences of AT1 receptors between the afferent end efferent arterioles are expressed the different contractile character of arterioles related with AT1-B receptors.
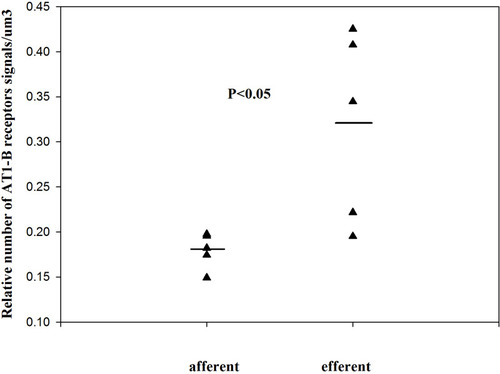
Figure 2 The relative number of angiotensin II AT1-A receptors on renin-positive and renin-negative SMCs of normal afferent arterioles (single values + mean, Mann–Whitney test). Reproduced with permission from Razga Z, Nyengaard JR. Up- and down-regulation of angiotensin II AT(1)-A and AT(1)-B receptors in afferent and efferent rat kidney arterioles. Journal of the Renin-Angiotensin-Aldosterone System 2008; 9: 196–201. Copyright © 2008, © SAGE Publications.Citation15 This significant differences of AT1 receptors show the trans-differentiation between the renin-positive and renin-negative SMCs related to angiotensin II AT1-A receptors subtype.
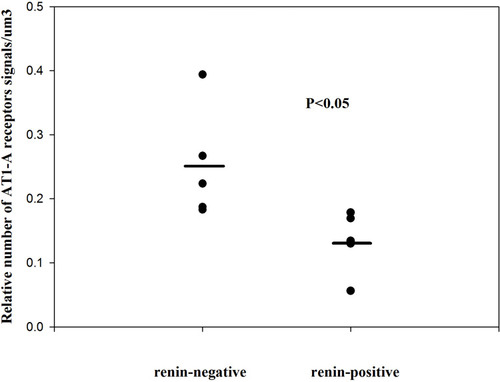
Figure 3 In STZ-induced diabetes, the angiotensin II AT1 receptors are downregulated in both renin-positive and renin-negative SMCs of kidney arterioles. Adapted from Razga Z, Kovacs G, Bodi N, Talapka P, Nyengaard JR. Heterogeneous downregulation of angiotensin II AT1-A and AT1-B receptors in arterioles in STZ-induced diabetic rat kidneys. Biomed Res Int. 2014;2014:1–6. the Creative Commons Attribution License (https://creativecommons.org/licenses/by/4.0/).Citation9 In diabetes the main morphological changes the high renin granulation with the high angiotensin II level in kidney tissue. This apparent discrepancy was resolved by finding the downregulation of angiotensin II AT1-A receptors (A). The downregulation of angiotensin II AT1-B receptors showed the contractile behavior of both arterioles were changed to abnormal in diabetes (B).
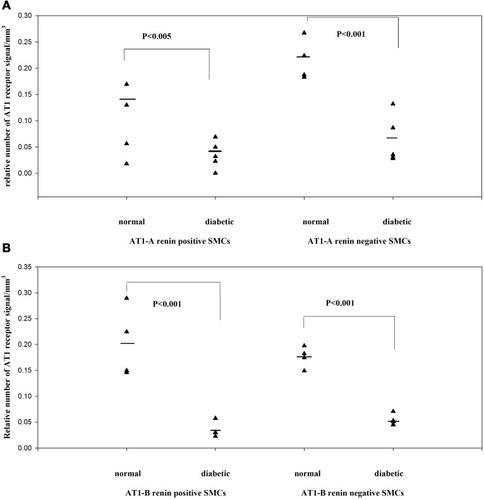
Figure 4 The number of renin receptors on the surface of afferent arteriolar SMCs. Adapted from Razga Z, Kovacs G, Bódi N, Talapka P, Bagyánszki M. Regulation of (Pro)Renin receptor in renin-positive smooth muscle cells of kidney arterioles in rats with STZ-induced diabetes. Int J Nephrol. 2019;2019:6. Creative Commons Attribution License (https://creativecommons.org/licenses/by/4.0/).Citation24 Significant difference was found in relative number of renin receptors between the renin-negative and renin-positive SMCs in normal, but not in diabetes. This difference expressed the renin receptor related to renin granulation that is the trans-differentiation between the renin-positive and renin-negative SMCs in normal. But in diabetes this difference is not presented which was showed the pathological state was processed from normal.
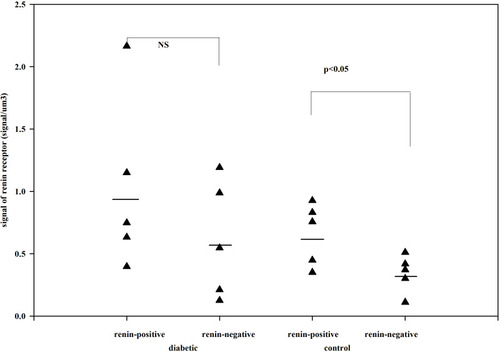
Figure 5 The number of renin receptors in the cytoplasm of afferent arteriolar SMCs. Adapted from Razga Z, Kovacs G, Bódi N, Talapka P, Bagyánszki M. Regulation of (Pro)Renin receptor in renin-positive smooth muscle cells of kidney arterioles in rats with STZ-induced diabetes. Int J Nephrol. 2019;2019:6. Creative Commons Attribution License (https://creativecommons.org/licenses/by/4.0/).Citation24 The same distribution is presented as in surface of SMCs. The renin receptors in cytoplasm of SMCs are related to trans-differentiation of renin-granulated cells from SMCs.
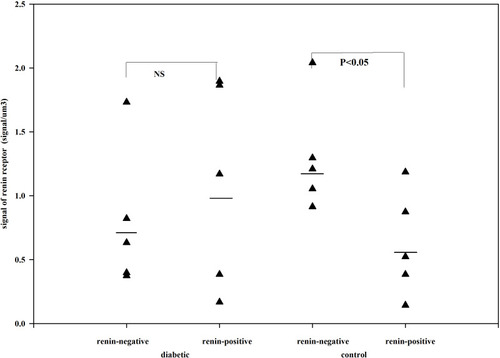
Figure 6 The total volume of MD in control and candesartan-treated groups. After treatment with candesartan the volume of MD increased (Paired T-test; p<0.007) by increasing the number of MD cells. Reproduced with permission from Razga Z, Nyengaard JR. The effect of angiotensin II on the number of macula densa cells through the AT1 receptor. Nephron Physiology 2009; 112: 37–43. Copyright © 2009, © 2009 S. Karger AG, Basel.Citation1 The total volume of MD is could be changed in the life related to the activity of RAS.
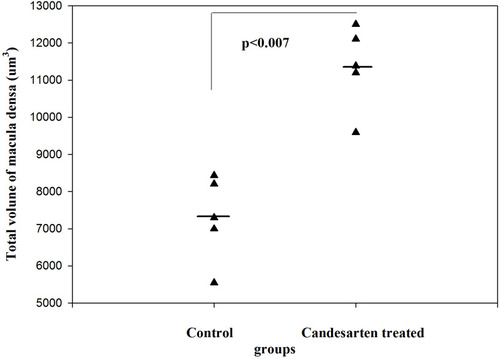
Figure 7 The total number of MD cells in control and candesartan-treated groups. There is a significant increase in the candesartan-treated group vs the control (Paired T-test; p<0.011). Reproduced with permission from Razga Z, Nyengaard JR. The effect of angiotensin II on the number of macula densa cells through the AT1 receptor. Nephron Physiology. 2009; 112: 37–43. Copyright © 2009, © 2009 S. Karger AG, Basel 0.Citation1 The changes of total volume of MD are a changes in number of MD cells related to activity of RAS. The proliferation of MD cells was excluded by immunohistochemistry of Ki67 and BrdU test,Citation1 so the changes in number of MD cells are the trans-differentiation related process.
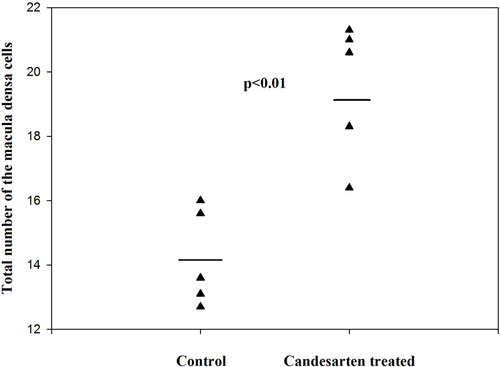
Figure 8 The volume of MD cells in the control and candesartan-treated groups. There are no significant differences between the two group. Reproduced with permission from Razga Z, Nyengaard JR. The effect of angiotensin II on the number of macula densa cells through the AT1 receptor. Nephron Physiology. 2009; 112: 37–43. Copyright © 2009, © 2009 S. Karger AG, Basel.Citation1 The size of MD cells were not changed, while the volume of MD increased by treatment of candesartan. This is evidence for increment of MD caused by increment of number of MD cells related to activity of RAS.
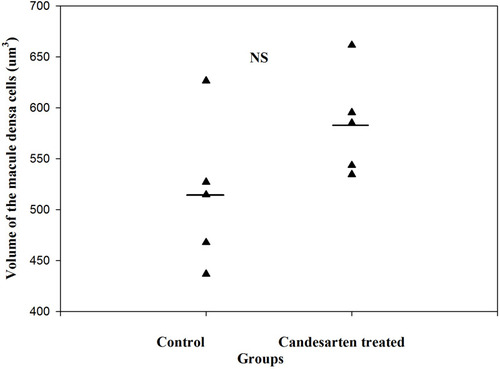
Table 1 The Number of Angiotensin II AT1 Receptors on the Macula Densa.Citation1 The Total Volume of MD and Normal Tubular Cells Facing the MD Cells Were Estimated, Which Made Available to Calculate the Total Number of Angiotensin II AT1 Receptors in These Cells. The Difference Between the Normal Tubular Cells Facing the MD Cells and MD Cells in Total Number of Angiotensin II AT1 Receptors Is so Few (154,6), but Enough for the Cells Make Totally Change Their Function and Morphological Behave