137
Views
9
CrossRef citations to date
0
Altmetric
Original Research

Expression Levels of miR-30c and miR-186 in Adult Patients with Membranous Glomerulonephritis and Focal Segmental Glomerulosclerosis

, , , & ORCID Icon
Pages 193-201 | Published online: 10 Aug 2020

Figures & data

Table 1 Demographic and Baseline Clinical Data

Figure 1 The expression of miRNA-30c-5p and miRNA-186-5p in plasma and PBMCs. The expression of miRNA-30c-5p in (A) Plasma and (B) PBMCs between the studied groups. The expression of miRNA-186-5p in (C) Plasma and (D) PBMCs between the studied groups. The relative expression (fold change) was calculated by the 2−ΔΔCt method. * and ○ are outliers.

Abbreviations: NS, nephrotic syndrome; FSGS, focal segmental glomerulosclerosis; MGN, membranous glomerulonephritis.
Figure 1 The expression of miRNA-30c-5p and miRNA-186-5p in plasma and PBMCs. The expression of miRNA-30c-5p in (A) Plasma and (B) PBMCs between the studied groups. The expression of miRNA-186-5p in (C) Plasma and (D) PBMCs between the studied groups. The relative expression (fold change) was calculated by the 2−ΔΔCt method. * and ○ are outliers.

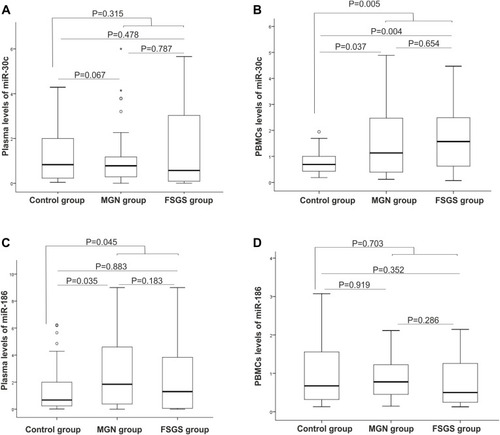
Table 2 Internal Correlations Between miRNA Levels in Plasma and Peripheral Blood Cells

Table 3 Results of the ROC Curve Analysis for Discriminating Potential of PBMC and Plasma miR-30c and miR-186 Levels Among Pairs of the Studied Groups

Figure 2 The combined ROC curves analysis of miR-30c and miR-186 in plasma and PBMCs samples. (A) Plasma and (B) PBMCs levels of the studied miRNAs could discriminate NS patients from controls. (C, D) ROC curve for the potential of the studied miRNAs in discriminating FSGS from MGN patients in (C) Plasma and (D) PBMCs. AUCs and the corresponding statistics of each miRNA between the groups are shown in .

Abbreviations: ROC, receiver operating characteristic; AUC, area under the curve.
Figure 2 The combined ROC curves analysis of miR-30c and miR-186 in plasma and PBMCs samples. (A) Plasma and (B) PBMCs levels of the studied miRNAs could discriminate NS patients from controls. (C, D) ROC curve for the potential of the studied miRNAs in discriminating FSGS from MGN patients in (C) Plasma and (D) PBMCs. AUCs and the corresponding statistics of each miRNA between the groups are shown in Table 3.

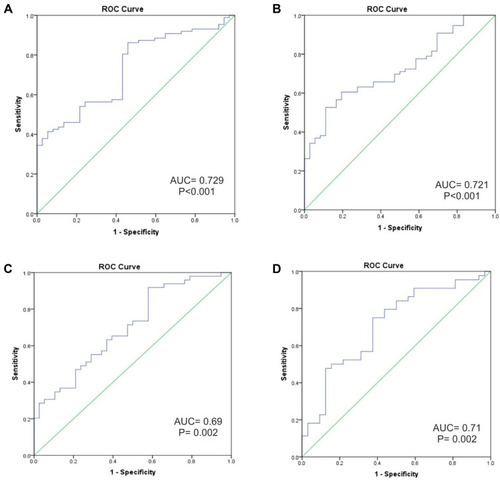
Table 4 The Ten Top Enriched Biological Processes Among Target Genes of miR-30c and miR-186