
Figures & data
Figure 1 Antimicrobial barrier cap (ClearGuard™ HD) used in the chlorhexidine group.
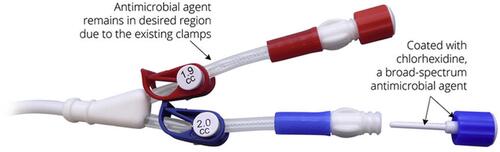
Table 1 Comparison of CLABSI Rates by Study Group
Table 2 Comparison of CLABSIs by Study Month and Study Group
Figure 2 CLABSI/1000 CVC days by study group.
Notes: *Standard group had 0 CLABSIs out of 5970 CVC days and chlorhexidine group had 0 CLABSIs out of 5670 CVC days during May 2018.Abbreviations: CLABSI, central line-associated bloodstream infection; CVC, central venous catheter.
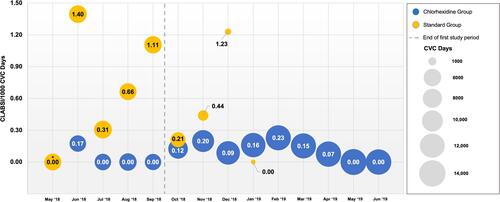
Table 3 Causative Organisms Isolated from Central-Line Associated Bloodstream Infections Among Patients Dialyzed via Central Venous Catheters