Figures & data
Table 1 Number of mice for different treatments used in the study
Figure 1 Morphine treatment exacerbates renal pathology in NY1DD mice. H&E stained kidney sections of NY1DD mice treated with morphine for 3 weeks. Cortical and cortico-medullary regions with glomerular and tubular histology are shown. Glomerular and tubular morphology in PBS-treated mouse kidneys (A and B). Note the severe intraglomerular congestion (C and E, black arrows), tubular dilatation and loss of brush border (D, green arrow), and peritubular congestion (black arrow) in morphine-treated mice.
Abbreviations: H&E, hematoxylin and eosin; MS, morphine sulfate, PBS, phosphatebuffered saline.
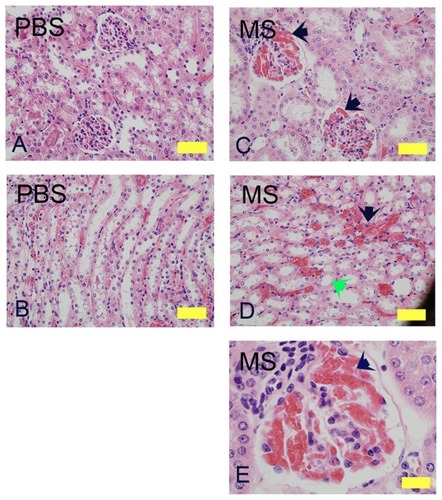
Figure 2 Morphine treatment exacerbates renal pathology in hBERK1 and HbA-BERK mice. (A–D) PAS-stained kidney sections from hBERK1 mice treated with morphine and/or naloxone for 6 weeks. Note the glomerular enlargement, increased mesangial cell density (black arrow), and parietal cell metaplasia (green arrow) in (B).
Abbreviations: H&E, hematoxylin and eosin; HbA, hemoglobin A; MS, morphine sulfate; Nal, naloxone; PAS, periodic acid-Schiff; PBS, phosphate-buffered saline.
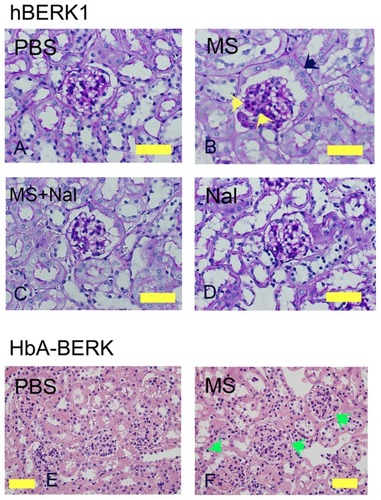
Figure 3 Morphine treatment exacerbates renal pathology in BERK mice. Kidney sections from BERK mice treated with PBS or MS for 6 weeks. (A and C) Glomeruli stained with PAS to show the basement membrane. Note that the tubules in PBS-treated mice are lined with intact epithelium and a brush border. In morphine-treated mice (C), the glomerulus is much larger than that in PBS-treated and shows parietal cell metaplasia (green arrow); tubules show basement membrane without epithelial cells (left yellow arrow) or epithelial cells sloughing off of the basement membrane (right yellow arrow) with a proteinaceous deposit (yellow *). Parietal epithelial cell metaplasia can be seen more prominently at the higher magnification in (E) (green arrow). In (D), the H&E-stained images show prominent vascular congestion (black arrows), early tubular epithelial cell necrosis (left yellow arrow), loss of epithelial cells and brush border (right yellow arrow), and proteinaceous deposits (turquoise arrow).
Abbreviations: H&E, hematoxylin and eosin; MS, morphine sulfate; PAS, periodic acid-Schiff; PBS, phosphate-buffered saline.
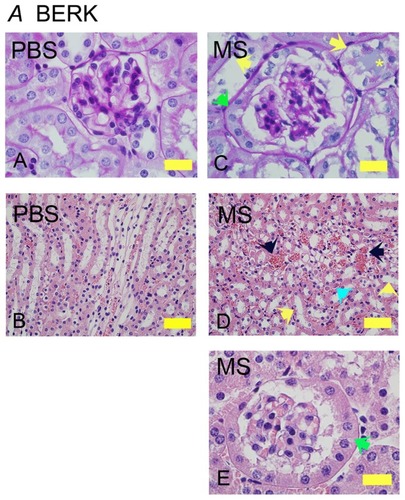
Figure 4 Electron microscopy images of morphine-induced glomerular alterations in BERK-sickle mice. Electron micrographs of kidneys from BERK mice treated with PBS or morphine for 3 weeks. (A and B) Electron micrographs of kidneys from PBS-treated BERK mice. (A) Normal podocyte foot processes (green arrow) and (B), normal mesangial region (mesangial cell, yellow arrow and mesangial matrix, turquoise arrow) in male BERK mice treated with PBS. (C–E) Electron micrographs of BERK mice treated with morphine for 3 weeks. (C) Foot process effacement (green arrow) and marked microvillus (mv) transformation in the kidney of female BERK mice treated with morphine. (D) Marked expansion of mesangial matrix (turquoise arrow), podocyte (green arrow), and increased mesangial cells (yellow arrow), but no immune complexes in the kidneys of male BERK mice treated with morphine. (E) Foot process effacement (green arrow) in the kidney of male BERK mice.
Abbreviations: mc, mesangial cell; mm, mesangial matrix; mv, microvillus; pcfp, podocyte foot processes; PBS, phosphate-buffered saline.
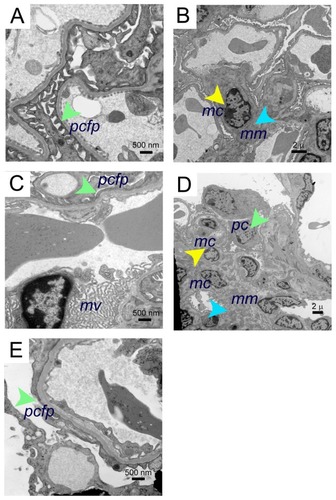
Figure 5 Morphine treatment increases glomerular volume. (A–C) Glomerular volume of NY1DD (A), hBERK1 (B), and BERK (C) mice treated with morphine and/or naloxone for 3 or 6 weeks as indicated. Note that morphine stimulates a significant increase in glomerular volume, which is abrogated by co-treatment with naloxone, although naloxone alone did not alter glomerular volume.
Abbreviations: MS, morphine sulfate; Nal, naloxone; PBS, phosphate-buffered saline; SD, standard deviation.
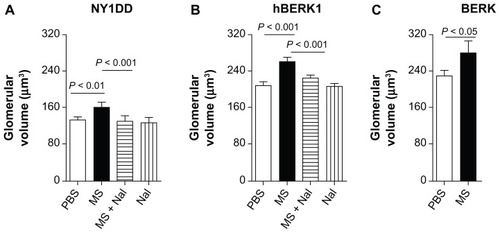
Figure 6 Morphine treatment increases kidney weight and urine albumin. (A) Kidney: body weight ratio of NY1DD, hBERK1, and BERK mice treated with morphine as indicated. (B) NY1DD mice were treated with morphine for 3 weeks. Urine was collected before beginning treatment and periodically following treatment.
Abbreviations: MS, morphine sulfate; Nal, naloxone.
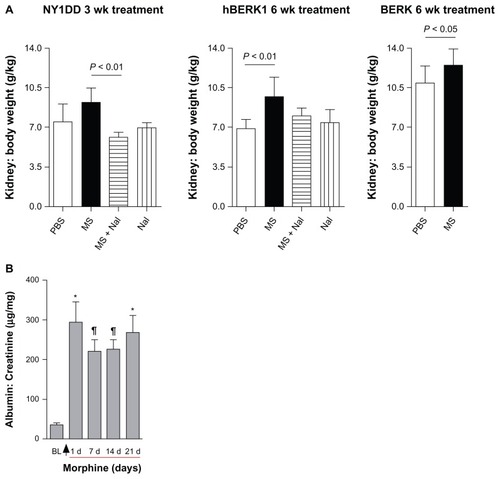
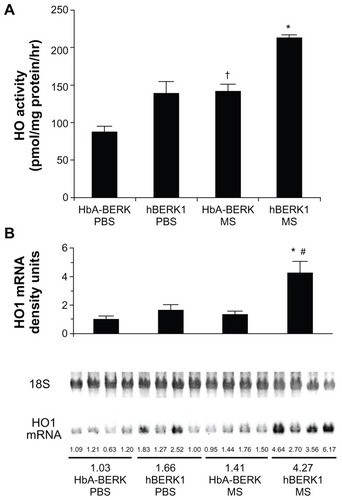
Figure 7 Morphine stimulates heme oxygenase (HO) activity and alters kidney function. (A) HO activity in the kidney of HbA-BERK and hBERK1 mice after 3 weeks of morphine treatment. Each bar represents the mean ± SEM of 4 mice/group. *P < 0.001 compared with hBERK1 mice treated with PBS or HbA-BERK mice treated with MS; †P < 0.01 compared with HbA-BERK PBS. (B) HO1 mRNA expression in the kidney of HbA-BERK and hBERK1 mice after 3 weeks of morphine treatment.
Abbreviations: HbA, hemoglobin A; PBS, phosphate-buffered solution; MS, morphine sulfate; HO1, heme oxygenase 1.