
Figures & data
Figure 1 Flow diagram for selection of the study cohort.
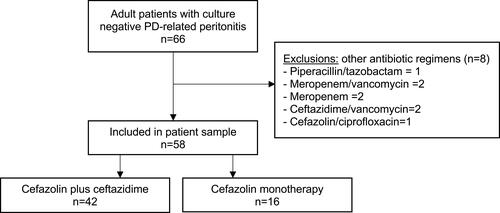
Figure 2 Flow diagram of the antibiotic prescription decision-making process in the management of PD-related peritonitis and routine of laboratory tests in our clinical practice.
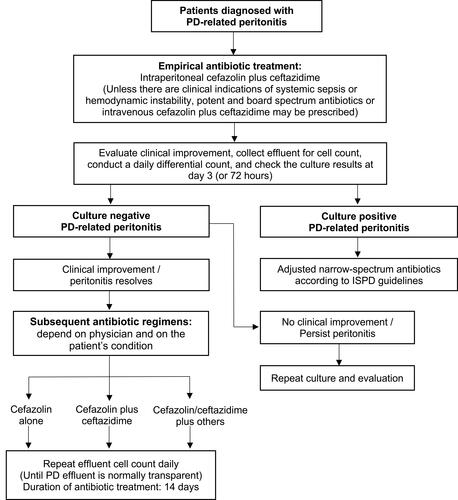
Table 1 Comparison of Patient Characteristics and Clinical Data Based on Antibiotic Therapy
Table 2 Empirical Antibiotic Regimens and Clinical Outcomes of Culture-Negative Peritonitis by Antibiotic Treatment in Subsequent Management
Figure 3 Kaplan–Meier curves of cumulative primary response in culture-negative peritonitis patients who received cefazolin plus ceftazidime (combination) and those who received cefazolin alone (monotherapy).
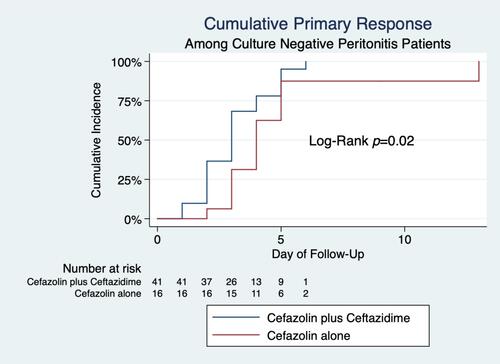
Table 3 The Results of Univariate and Multivariate Cox Regression Analysis Regarding Primary Response