Figures & data
Table 1 Patient Characteristics at Baseline
Table 2 Comparison of Changes in Clinical Parameters and CKD-MBD Medication Use
Figure 1 Monthly distribution of patients stratified by sP level.
Abbreviations: PB, phosphate binder; SO, sucroferric oxyhydroxide; sP, serum phosphorus.
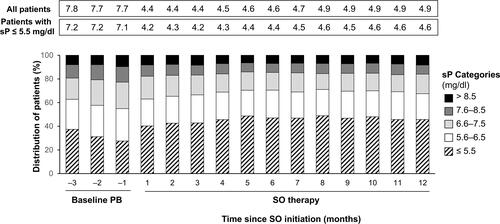
Figure 2 Percentage of patients achieving sP ≤5.5 mg/dl stratified by baseline PB type: (A) Sevelamer → SO, (B) Calcium acetate → SO, (C) Lanthanum carbonate → SO, (D) Ferric citrate → SO.
Abbreviations: PB, phosphate binder; SO, sucroferric oxyhydroxide; sP, serum phosphorus.
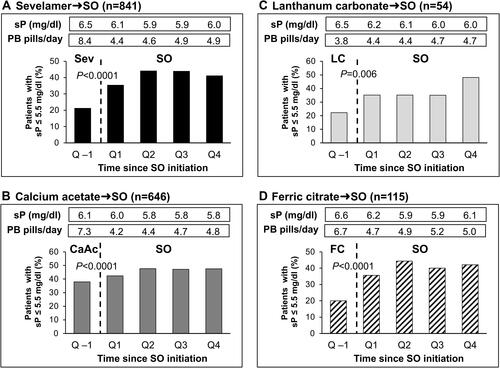
Table 3 Comparison of Changes in Anemia and Iron Indices and in Anemia Therapies
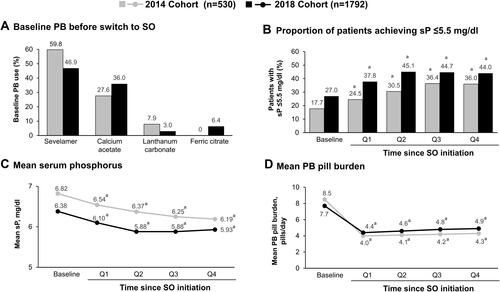
Figure 3 Observations in the 2014 and 2018 cohorts: (A) Baseline PB before switch to SO, (B) Proportion of patients achieving sP ≤5.5 mg/dl, (C) Mean serum phosphorus, and (D) Mean PB pill burden. aP < 0.0001 vs baseline.
Abbreviations: PB, phosphate binder; SO, sucroferric oxyhydroxide; sP, serum phosphorus.