Figures & data
Table 1 Clinical Characteristics Stratified According to Indoxyl Sulfate Levels
Table 2 Univariate and Multivariate Linear Regression Analyses for Indoxyl Sulfate
Figure 1 Linear regression curve. Relationship between serum levels of indoxyl sulfate and global longitudinal strain.
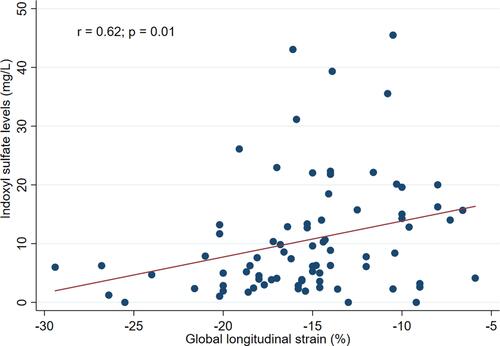
Table 3 Univariate and Multivariate Cox Proportional Hazards Models of Dialysis Initiation During Follow-Up
Figure 2 Kaplan–Meier curves of cumulative event-free survival for dialysis according to low- and high- indoxyl sulfate group.
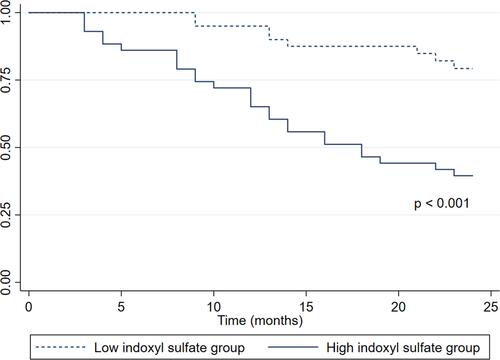
Table 4 Cox Univariate and Multivariate Regression Analyses for Predictors of Cardiovascular Events
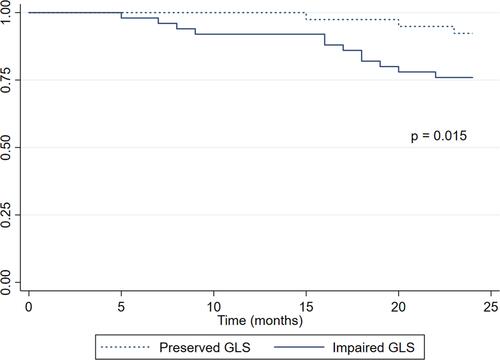
Figure 3 Kaplan–Meier curve of the cumulative cardiovascular event-free survival stratified by GLS (preserved and impaired GLS groups).