Figures & data
Figure 1 Survival analysis incorporating time-dependent and cumulative characteristics of the exposure (bacteriuria) and treatment among females with chronic kidney disease. The figure shows four hypothetical cohort members (A–D) with various cohort entry dates and variable numbers of infections and antibiotic treatment courses during the study period.
Notes: Survival analyses in this study treat the exposure dynamically, by incorporating both the timing and cumulative burden of infectious events (the first number in parentheses), as well as the cumulative treatment status (second number in each parenthesis) in multiple-determinant models. This is in contrast to more traditional “fixed” models in which exposure status is assigned based upon a single event at one point in time. With a dynamic model, the exposure status for each cohort member is fully characterized and updated over time.Citation13
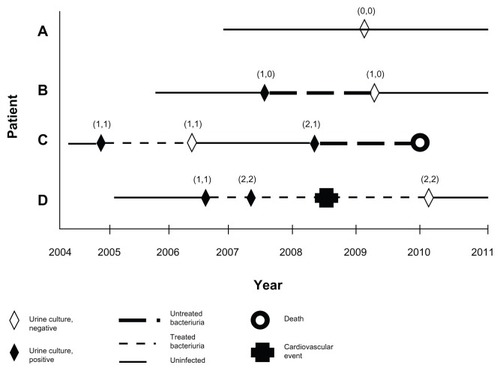
Table 1 Baseline characteristics of adult females with CKD, by outpatient bacteriuria and treatment status (2004–2009)
Table 2 Crude rates (death and cardiovascular events) among adult females with CKD, by bacteriuria and treatment status
Table 3 Cox proportional hazard model for mortality and cardiovascular events among adult females with CKD, by treatment status after bacteriuria