
Figures & data
Figure 1 The lung ultrasonography demonstrates the B-lines (arrows).
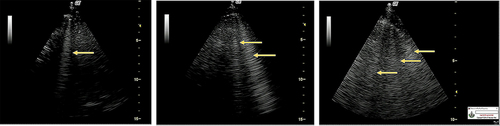
Figure 2 Twenty-eight areas of total lung ultrasonography prescribed by Jambrik et al.Citation29
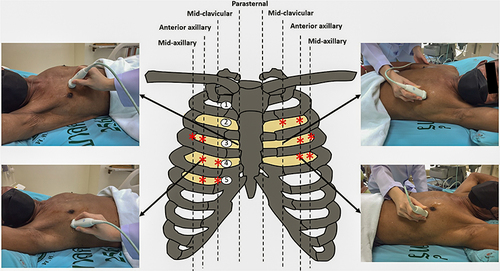
Table 1 The Baseline Characteristics of Patients in the Study (n=20)
Table 2 Comparisons of Clinical Parameters, Total Lung Ultrasound Scores and Bioimpedance Values at Baseline and Week Eight
Figure 3 The correlation between the total lung ultrasound scores and accumulated weight gains (r=0.377).
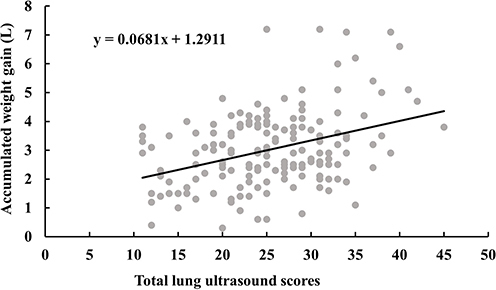
Table 3 Comparison of Accumulated Weight Gains Categorized as Severities of Pulmonary Congestion and Total Lung Ultrasound Score Groups
Figure 4 The box-and-whisker diagram shows median and interquartile ranges and the X-line represent the mean values of weight gain amounts categorized as the groups of total lung ultrasound scores.
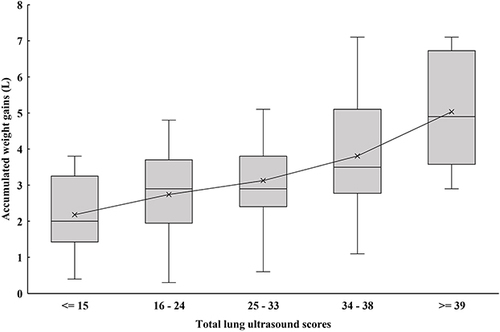
Table 4 Correlations Between Lung Ultrasound Score in Each Position with Total Lung Ultrasound Score and Accumulated Weight Gain
Figure 5 The correlation between sum scores of 12 specific lung area and total lung ultrasound scores placing on 28 lung areas (r=0.918).
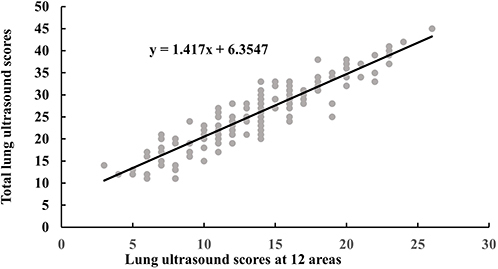
Table 5 The Correlation Between BIA Parameters with Total LUS Score and WG