95
Views
56
CrossRef citations to date
0
Altmetric
Review

Renal manifestations of genetic mitochondrial disease

Pages 57-67 | Published online: 31 Jan 2014

Figures & data

Figure 1 Mitochondrial genome with the positions of mutations associated with a kidney phenotype. A schematic of the circular 16,569 base pair human mitochondrial genome is shown with the position of 13 protein-coding mitochondrial genes (ND1, ND2, CO1, CO2, ATP8, ATP6, CO3, ND3, ND4L, ND4, ND5, ND6, CYTB), two ribosomal ribonucleic acid (RNA) molecules (RNR1, RNR2) and the noncoding D-loop, depicted as labeled boxes on the interior of the circle. The position of the 22 mitochondrial transfer RNAs (tRNAs) is shown with the solid-gray boxes with the single-letter amino acid designation shown for the respective tRNA. The position of the mitochondrial transfer deoxyribonucleic acid (mtDNA) single-base mutations are shown with a solid-bold line on the interior of the circle connected to a light line indicating the base position of the mutation. Large mitochondrial DNA deletions are represented by bold lines labeled 1–8 on the exterior of the circle phenotype.

Figure 1 Mitochondrial genome with the positions of mutations associated with a kidney phenotype. A schematic of the circular 16,569 base pair human mitochondrial genome is shown with the position of 13 protein-coding mitochondrial genes (ND1, ND2, CO1, CO2, ATP8, ATP6, CO3, ND3, ND4L, ND4, ND5, ND6, CYTB), two ribosomal ribonucleic acid (RNA) molecules (RNR1, RNR2) and the noncoding D-loop, depicted as labeled boxes on the interior of the circle. The position of the 22 mitochondrial transfer RNAs (tRNAs) is shown with the solid-gray boxes with the single-letter amino acid designation shown for the respective tRNA. The position of the mitochondrial transfer deoxyribonucleic acid (mtDNA) single-base mutations are shown with a solid-bold line on the interior of the circle connected to a light line indicating the base position of the mutation. Large mitochondrial DNA deletions are represented by bold lines labeled 1–8 on the exterior of the circle phenotype.

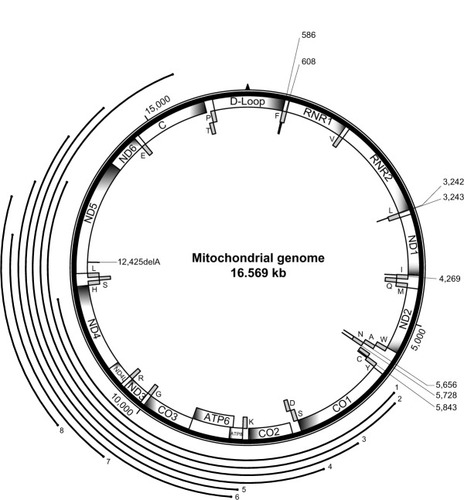
Table 1 Mitochondrial DNA mutations associated with a kidney phenotype

Table 2 Nuclear genes encoding mitochondrial proteins associated with a kidney phenotype