Figures & data
Figure 1 Inhibition of sphingolipid metabolism by opaganib. Opaganib (also known as ABC294640) inhibits sphingosine kinase-2 (SK2) resulting in reduced synthesis of sphingosine 1-phosphate (S1P), thereby suppressing pathologic inflammation. In parallel, opaganib also inhibits dihydroceramide desaturase (DES1) resulting in accumulation of dihydroceramides, which promotes autophagy.
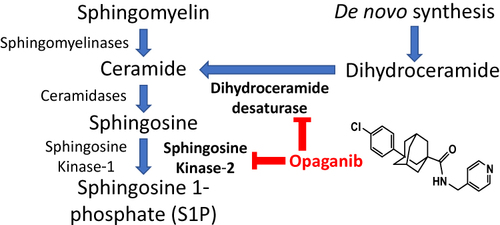
Figure 2 Opaganib improves renal function after moderate ischemia-reperfusion. Mice were treated with vehicle or opaganib (50 mg/kg) by oral gavage immediately prior to bilateral clamping of the kidney pedicles for 25 min. No surgery was performed in the Sham treatment group. Blood was drawn 24 h after reperfusion and assayed for serum creatinine (A) and BUN (B) levels. Additionally, kidney lysates were assayed for myeloperoxidase activity (C). Bars show the mean ± SD values for Sham-IR (n=5), vehicle-treated (n=5) and opaganib-treated (n=4) groups. ##Indicates p < 0.01 compared with the Sham treatment group.
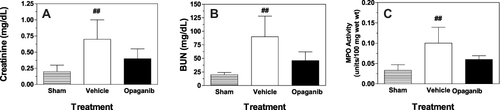
Figure 3 Opaganib promotes survival after severe ischemia-reperfusion. Mice were treated with vehicle (□, n=6) or 50 mg/kg opaganib (●, n=4) by oral gavage immediately prior to induction of severe kidney ischemia-reperfusion by ligating and removing the right kidney and then clamping the left kidney for 45 min. Mice were monitored for morbidity daily, and the percentages of surviving animals are shown. **Indicates p < 0.01 compared with the Vehicle treatment group.
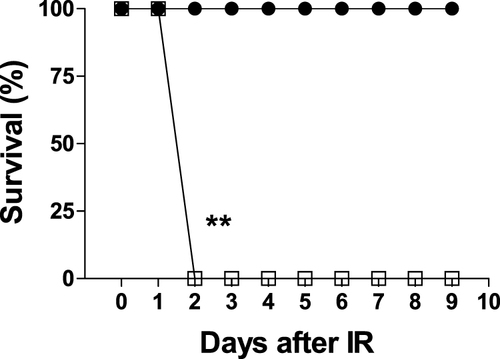
Figure 4 Opaganib improves renal function after severe ischemia-reperfusion. Mice were treated with vehicle or 50 mg/kg opaganib by oral gavage immediately prior to induction of severe kidney ischemia-reperfusion. No surgery was performed in the Sham treatment group. Serum levels of creatinine (A) and BUN (B) were measured on Day 2 or Day 10 (opaganib treatment group only). Kidneys were harvested on Day 2 for myeloperoxidase (MPO) assays (C). ##Indicates p < 0.01 compared with the Sham treatment group. *Indicates p < 0.05, **Indicates p < 0.01, and ***Indicates p < 0.001 compared with Vehicle treatment group.
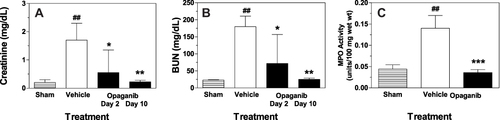
Figure 5 Opaganib attenuates histologic renal damage from severe ischemia-reperfusion. Mice were treated with vehicle or 50 mg/kg opaganib by oral gavage immediately prior to induction of severe kidney ischemia-reperfusion. No surgery was performed in the Sham treatment group. At 4 or 48 hr after reperfusion, mice were sacrificed and kidneys were harvested, fixed, sectioned and stained with hematoxylin and eosin. (A) Representative sections are shown. (B) Histology Scores were calculated as described in the Materials and Methods section. Bars show the mean ± SD values for Sham (n=5), vehicle (n=6) and opaganib (n=8) treatment groups. ##Indicates p < 0.01 compared with the Sham treatment group. ***Indicates p < 0.001 compared with the Vehicle treatment group. (C) To assess the consistency of the data, serum creatinine and Histology Score values are shown for individual mice from the vehicle (□) and opaganib (●) treatment groups.
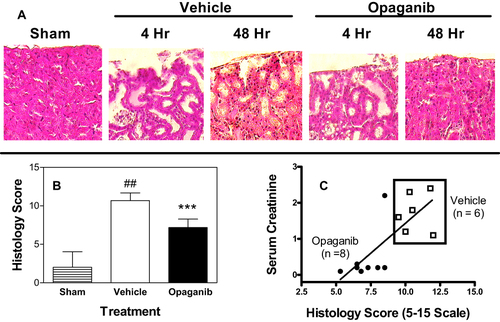
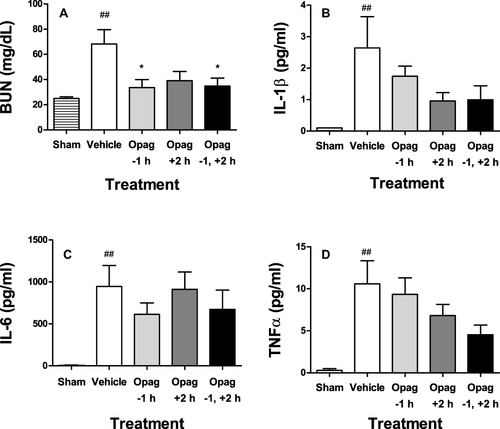
Figure 6 Opaganib preserves renal function and suppresses inflammation in lipopolysaccharide-induced sepsis. Mice were treated with opaganib (100 mg/kg) or vehicle by oral gavage at 1 hr before and/or 2 hr after lipopolysaccharide (LPS) injection. No LPS was administered in the Sham treatment group. Blood was drawn 24 hr after LPS administration and assayed for BUN (A), IL-1β (B), IL-6 (C) and TNFα (D). Bars show the mean ± SD values for n=4–6 mice per treatment group. ##Indicates p < 0.01 compared with the Sham treatment group. *Indicates p < 0.05 compared with the Vehicle treatment group.